The XRP Ledger has never been this busy. And XRP's token has never looked this broken relative to its network.
Two numbers tell the story. Daily successful payments on XRPL just hit 2.7 million, up from roughly 1 million in late 2025, according to XRPSCAN data. That's a 170% increase in less than six months. Automated market maker pools have exploded to 27,000. Tokenized real-world assets on the ledger climbed to $461 million, up 35% in a single month. Stablecoin transfers hit $1.19 billion in 30 days.
XRP the token is trading at $1.37. It's down 26% year-to-date. It's 62% below its late-2025 high of $3.65.
That's not a short-term dip. That's a structural failure of the most fundamental thesis in crypto: that network usage drives token value. XRP is either the most undervalued Layer-1 in the market, or it's proving that utility and price are, at least for certain token designs, completely disconnected.
Meanwhile, the rest of the market is setting up for its own reckoning. Bitcoin is holding $71,000 after the U.S. bombed Kharg Island - Iran's main crude export facility - and the price barely moved. Circle, a company that didn't exist in the tokenized treasury market 14 months ago, just overtook BlackRock. The tokenized Treasury market just hit $11 billion. And in 72 hours, the Federal Reserve meets with oil above $100 and the biggest energy supply disruption in recorded history as context.
This is the full breakdown.
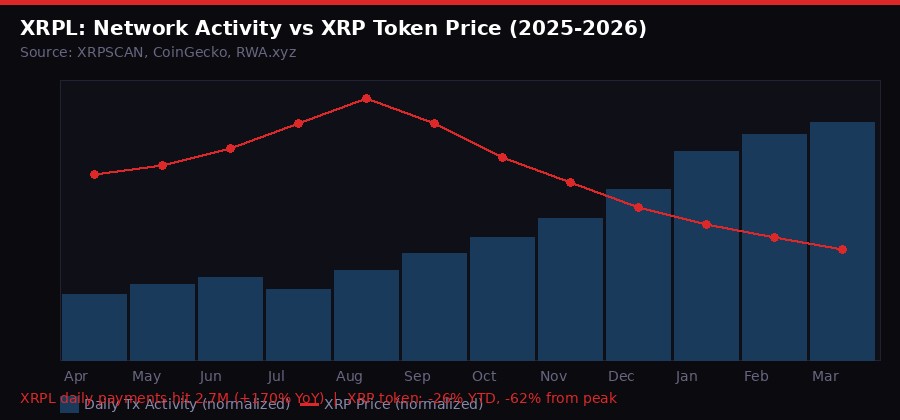
XRPL daily payment activity vs XRP token price (normalized, 2025-2026). The divergence beginning Q4 2025 is the story. Source: XRPSCAN, CoinGecko, RWA.xyz
The XRP Paradox: When Utility Doesn't Pay the Token
Every metric that should matter for a utility token is moving in the right direction on XRPL. The question is whether any of it has anything to do with the token's price.
The network is processing between 2 and 2.8 million transactions per day at 20-26 transactions per second, per XRPSCAN data. For comparison, Ethereum mainnet averages around 13-14 TPS. XRPL is faster, cheaper, and right now, more active on a per-day basis for payments specifically.
The AMM expansion is real. From a standing start when Ripple launched AMM functionality in 2024, the ledger now has 27,000 active pools supporting 16,000+ unique tokens. Tokenized RWA value jumped 35% in 30 days to $461 million - ahead of several chains with far larger DeFi ecosystems in the specific tokenization category.
XRPL Network Metrics - March 2026
The DeFi number kills the bull case in one line. XRPL carries $47.54 million in total value locked. Solana has roughly $4 billion. Ethereum has $40+ billion. XRP's DeFi ecosystem is a rounding error next to a market cap of $84 billion - which means that cap is almost entirely speculation and ETF positioning, not capital doing productive work on the chain.
The structural explanation for the divergence goes to RLUSD, Ripple's stablecoin. More of XRPL's growing transaction volume is stablecoin-denominated activity that uses XRP as a transit mechanism - briefly, not as a held asset. A cross-border payment that routes through XRP for three seconds doesn't generate sustained buy pressure. It creates momentary demand and immediate sell pressure as the XRP is disposed of at the destination.
The bridge currency model was always the vision. The problem is that bridge currencies get used, not accumulated. That's the opposite of what price appreciation needs.
"The DeFi numbers make this stark. XRPL's total value locked is $47.54 million. That's the entire DeFi ecosystem on a chain whose native token has an $84 billion market cap." - CoinDesk Markets analysis, March 13, 2026
There's one genuine bright spot in the data. The 30-day RWA transfer volume of $149 million, up over 1,300%, shows real institutional activity rather than retail wash trading. If Ripple's tokenization thesis plays out over 2026-2027, XRPL holds a ledger-level infrastructure position that most competitors lack. But that's a three-year thesis, not a Q1 catalyst.
Seasonality gives the bulls something to point at. March has historically averaged an 18% return for XRP. The $1.27-$1.30 support zone has held through multiple tests. If the Iran war moves toward de-escalation and macro conditions stabilize, a relief bounce to $1.60+ is plausible on technicals alone.
But the structural disconnect between network activity and token economics hasn't been resolved. It's been clarified.
Bitcoin at $71,000: The War Price Is Now the Base Price
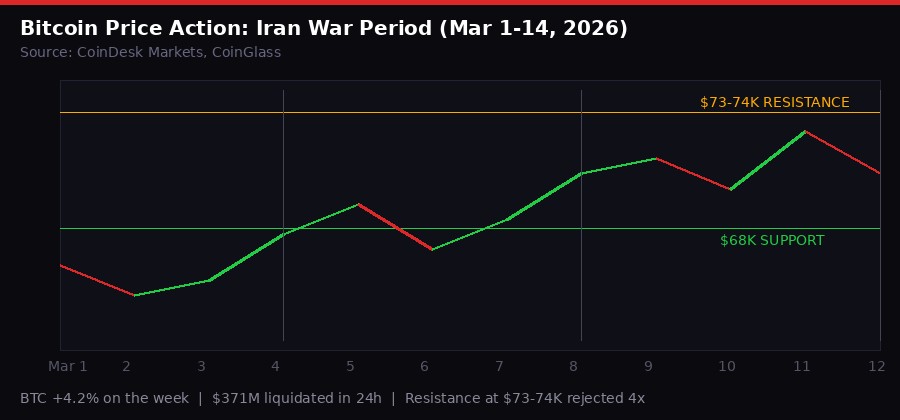
Bitcoin price action March 1-14, 2026. The $73-74K resistance level has rejected four times. Short/long liquidations both occurring at scale. Source: CoinDesk Markets, CoinGlass
Two weeks into a Middle Eastern war, and bitcoin is higher than where it started.
The U.S. bombed military targets on Kharg Island - Iran's main crude oil export facility - on Friday. Bitcoin was at $73,838 when the strikes were announced. It gave back 3.5% on the headline and stopped at $71,000. Two months ago, a comparable escalation would have triggered a 10-15% collapse. The market's war threshold has completely repriced.
The weekly performance tells the story. Bitcoin +4.2% over seven days. Ether gained 5.5% to $2,090. Dogecoin added 5%. Solana rose 4.2% to $88. BNB climbed 4.5% to $655. Every major token is green on the week despite the conflict intensifying, not easing - according to CoinDesk Markets data.
The $371 million in liquidations over the past 24 hours captured the two-way violence of Friday's session. Short liquidations outpaced longs at $207 million versus $163 million. The initial surge to $73,800 squeezed the shorts who had bet against a rally. Then the Kharg headlines hit, and the longs who had just entered on the squeeze got wiped. Both sides lost on the same day.
The $73,000-$74,000 resistance level has now rejected bitcoin four times in two weeks. It's not a ceiling of fear but one of positioning - every rally to that zone runs into overhead sellers who bought between $75K and $100K during the late-2025 bull run and are still trying to break even.
Trump's Thursday Truth Social post added a new conditional to the war risk model. He said U.S. strikes spared Iran's oil infrastructure "for reasons of decency" but would "immediately reconsider" if Iran continued blocking the Strait of Hormuz. Iran responded that any direct strike on energy infrastructure would trigger retaliatory attacks on U.S.-linked facilities in the region.
That's a new escalation ladder that didn't exist 48 hours ago. The IEA has already called this the largest energy supply disruption in recorded history. If oil infrastructure becomes a direct target, the supply shock gets dramatically worse - and the stagflation case, already hard to dismiss, becomes almost impossible to argue against.
The Fed Gauntlet: March 17-18 Is Now the Biggest Risk Event in Markets
The Federal Reserve's two-day meeting starts in three days. The rate decision - widely expected to be a hold at 3.5% to 3.75% per CME FedWatch at 95%+ probability - isn't the story. The dot plot and Powell's press conference are.
The inputs Powell walks into that room with: oil above $100 per barrel, the largest energy supply disruption in modern history, a war in its third week with no exit visible, CPI pressures that haven't fully resolved, and a labor market that refuses to break. The stagflation scenario - slowing growth, persistent inflation, constrained monetary policy options - is no longer a tail risk. It's a described scenario with supporting data.
The question crypto traders are pricing is not "will they hike?" - nobody expects that. The question is whether any member of the committee uses language that reopens the door to hikes, or whether the dot plot shifts hawkish versus December. Any hint that cuts are off the table until 2027, or that the committee's tolerance for inflation has lowered, would hit risk assets across the board.
Bitcoin has spent five months pricing in rate cuts that keep not arriving. That's a meaningful valuation drag that gets worse, not better, the longer the inflation story runs. The crypto market's resilience against the Iran war has been impressive - but war is a known unknown. The Fed is a known event with definable downside scenarios.
William Blair analysts put the bear case plainly in a Thursday note: while bitcoin's recent moves correlate with rising oil prices and potential Fed hawkishness, the actual driver of crypto resilience is something else - the structural separation of bitcoin from pure risk-asset behavior. That separation gets tested at the Fed meeting. If Powell signals hikes are back on the table, the test fails.
Circle Dethrones BlackRock: The $11 Billion Tokenized Treasury Coup
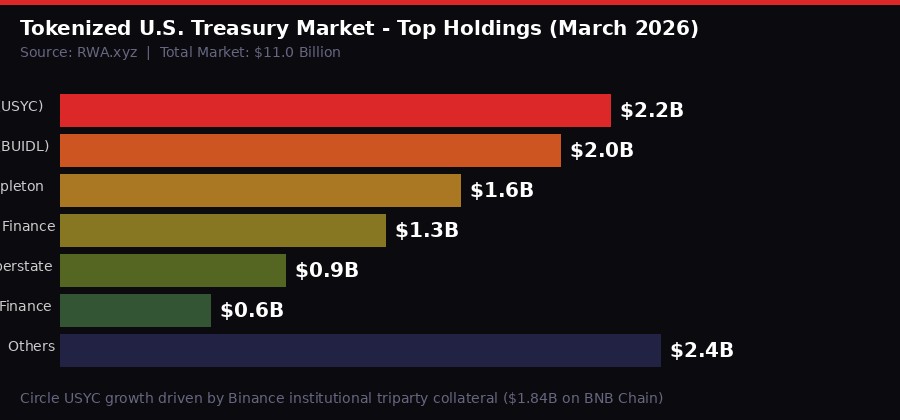
Tokenized U.S. Treasury market by provider, March 2026. Circle's USYC has grown to $2.2B, surpassing BlackRock BUIDL ($2.0B). Total market at record $11B. Source: RWA.xyz
Circle didn't exist in the tokenized treasury market 14 months ago. On Friday, it became the largest provider in the world.
Circle's USYC token - acquired when the company bought Hashnote in January 2025 - has grown to approximately $2.2 billion in supply, according to RWA.xyz data. That pushed USYC past BlackRock's USD Institutional Digital Liquidity Fund, BUIDL, which holds around $2 billion in assets. BUIDL's market share has shrunk to 18% from a 46% peak in May 2025 as competition increased and new entrants flooded the sector.
The math on USYC's growth is revealing. Of the $2.2 billion in supply, $1.84 billion sits on BNB Chain alone - deployed specifically as off-exchange collateral for institutional derivatives trading after Binance introduced USYC through its Banking Triparty program and Ceffu custody platform in July 2025. Binance effectively handed Circle a $1.84 billion institutional distribution channel in six months.
"Tokenized treasuries and repo as collateral is a major emerging use case and we are proud of how quickly this has grown." - Jeremy Allaire, Circle CEO, via post on X, March 13, 2026
The broader tokenized Treasury market hit a fresh record above $11 billion on the same day, per RWA.xyz. The sector added approximately $2.5 billion - about 27% - since January 1. The growth curve matters more than the absolute number: $11 billion is still a rounding error versus $28 trillion in outstanding U.S. Treasury debt, but the growth rate is accelerating, not slowing.
Tokenized Treasury Market Snapshot - March 2026
What's driving the acceleration during the crypto market's weakness is worth noting. The tokenized Treasury growth curve actually bent steeper during January's crypto downturn, suggesting institutional capital is parking in T-bill tokens to earn 4-5% annualized yield while waiting for opportunities to redeploy. The market is functioning as a crypto cash equivalent - yield-bearing, transparent, available 24/7, usable as derivatives collateral.
That's not speculation. That's institutional plumbing changing in real time. Traditional finance T-bill fund managers have had decades to build distribution. Circle built $2.2 billion in 14 months by embedding USYC into the world's largest derivatives exchange as collateral infrastructure.
BlackRock's BUIDL isn't going away - Securitize's institutional distribution and brand make it the preferred product for conservative TradFi allocators. But the competitive dynamics have fundamentally shifted. Circle's model - stablecoin issuer turns tokenization infrastructure provider - is now proven at scale.
Arthur Hayes on HYPE: The $150 Call and What It Actually Means
Arthur Hayes went on CoinDesk's Markets Outlook and made the HYPE call directly: Hyperliquid's native token could reach $150 by year-end, from around $27 currently. That's roughly a 5-6x from here.
Hayes is not a permabull on everything - he sold his firm's HYPE position at $50-$55 ahead of expected token unlock pressure. He turned bullish again specifically because the Hyperliquid team chose not to sell most of its monthly token allocations. That restraint changed his calculus.
The bull case in numbers: Hyperliquid generates close to $1 billion in annualized revenue based on 30-day fee data. It holds roughly 70% of perpetual DEX revenue share. Hayes argues it has the lowest volume-to-open-interest ratio among major perpetual DEXs - a metric he uses to identify genuine rather than incentive-inflated trading activity. The platform also offers the lowest slippage for large bitcoin perp trades in the $100K-$10M range.
Hyperliquid (HYPE) Key Metrics - March 2026
What makes the Hayes thesis interesting isn't just the revenue multiple. It's the product positioning. Hyperliquid's HIP-3 permissionless listing system has expanded trading beyond crypto into assets like oil and equity indices. Retail traders can access 10-20x leverage on Nasdaq proxies and oil contracts, 24/7, via stablecoin wallets, on-chain. That's a product that doesn't exist anywhere else with Hyperliquid's liquidity profile.
The Iran war has demonstrated the use case in live fire. When Trump's Kharg Island threats hit on a Friday evening - when traditional commodity markets were closed - Hyperliquid saw a surge in oil contract trading from retail participants who had no other way to express a view on the escalation. That's genuine product-market fit, not manufactured volume.
Hayes outlined his exit signals clearly. He'd reconsider if HYPE's price-to-earnings ratio rises sharply and sentiment becomes overwhelmingly bullish - the euphoria indicator. The second risk is competition: if a well-funded rival (Binance DEX, dYdX, or a new entrant) can offer lower fees and erode Hyperliquid's 70% revenue share, the valuation thesis breaks.
Hayes also surfaced a secondary thesis: privacy coins, specifically Zcash, as a growing narrative given blockchain surveillance concerns and AI-powered transaction analysis. He cited ZCash's cryptographic upgrades as a reason he prefers it to Monero. On Bitcoin, he reiterated his $250,000 year-end call - a target he's missed twice already but shows no interest in abandoning.
The Week's Timeline: From $73,800 to Kharg Island
What Breaks First: The Key Scenarios Heading Into the Fed
Three scenarios are on the table for March 17-18.
Scenario A - Hold and pause language: Powell delivers the expected hold with language that de-emphasizes rate hike risk and focuses on data dependency. CME FedWatch stays at 95%+ for hold through May. Bitcoin trades back toward $73K resistance. The $73-74K level breaks on a sustained basis by end of month. Probability: medium-high based on current Committee composition and public statements.
Scenario B - Hold with hawkish tilt: Powell acknowledges the oil/inflation dynamic explicitly. The dot plot shifts upward or shows reduced expectation for 2026 cuts. Powell doesn't rule out hikes explicitly but the market reads between the lines. Bitcoin drops back toward $65-67K. Crypto broadly underperforms equities. Probability: meaningful given oil at $100+ context.
Scenario C - Surprise cut signal: Powell argues that war-driven supply shocks are different from demand-driven inflation and that the underlying economy needs support. Any dovish surprise would be explosive for crypto. Bitcoin tests $75K+ immediately. Probability: low given recent Committee rhetoric and energy data.
The oil variable is what makes scenario B non-trivial. The IEA's "largest supply disruption in recorded history" language creates a legitimate CPI risk pathway even if U.S. domestic demand is softening. A committee that spent 2022-2024 behind the inflation curve has institutional memory of what it cost them to be slow. They know the optics of looking like they're cutting into an oil shock.
The crypto market has shown remarkable resilience to geopolitical escalation over the past two weeks. That resilience hasn't been tested by a domestic policy shock. The Fed meeting is that test. It arrives at exactly the wrong time - after a week of gains that have left positioning extended long, with liquidation pressure visible at both the $73K ceiling and the $68K floor.
The most important thing about current crypto positioning isn't the price. It's that $371 million in 24-hour liquidations required only a 3.5% move to execute. Leverage is not low. Leverage is concentrated right around the current price range. One hawkish sentence from Powell can cascade through that in ways that have nothing to do with fundamental value.
The Broader Picture: Three Seismic Shifts in One Week
Step back from the daily price noise and three structural shifts occurred this week that will matter for years.
First: the utility token model is being empirically tested in real time via XRP. A network processing 2.7 million transactions daily with record RWA activity and a declining token price is not a random data point. It's a case study in the difference between network utility and token economics. The XRP bridge currency model may be working perfectly while simultaneously failing to support the token price. That distinction matters for every chain that pitches itself on transaction volume metrics.
Second: tokenized Treasuries just became a real market. $11 billion with a 27% YTD growth rate and institutional distribution through Binance isn't a pilot project anymore. Circle getting to $2.2 billion in 14 months by embedding USYC as Binance's collateral layer is a distribution playbook that every stablecoin issuer and asset manager will study. The race for tokenized T-bill distribution is now fully on.
Third: the crypto market's war desensitization is complete. Two weeks of escalating Middle East conflict - culminating in strikes on Iran's primary oil export facility - produced a net positive weekly return for bitcoin. The market has fully repriced geopolitical risk. What it hasn't repriced is domestic monetary policy risk. That's what the next 72 hours tests.
The numbers for the week: Bitcoin +4.2%. Ether +5.5%. Tokenized treasuries at $11B record. XRP XRPL activity at 12-month highs while the token trails the broader market by 30 percentage points. Circle overtakes BlackRock. $371 million liquidated in a single session on a 3.5% move. Oil above $100 and still climbing.
The Fed decides Monday. Everything else is already priced.
Get BLACKWIRE reports first.
Breaking news, investigations, and analysis - straight to your phone.
Join @blackwirenews on Telegram