TABLE OF CONTENTS
- What XCracker Actually Does
- The X Algorithm Problem Everyone Ignores
- How to Use XCracker (2-Second Walkthrough)
- What Your Score Actually Means
- The Algorithm Signals XCracker Scores Against
- Shadowban Detection: The Feature Nobody Talks About
- How to Improve Your X Algorithm Score
- Free vs Paid: The Honest Comparison
- Who Actually Needs XCracker
- The Final Verdict
Let me be direct. Most people posting on X in 2026 are flying blind. They post content, get inconsistent reach, wonder why some tweets explode and others die, and eventually chalk it up to luck or "the algorithm being random."
It is not random.
X's algorithm is a scoring system. It ranks every account against a set of engagement signals - reply rate, repost rate, like rate, bookmark rate, native media presence, external link penalties - and uses that score to decide how widely to distribute your content. The score changes over time. It can be improved. And it can be broken by behaviors you'd never suspect.
XCracker reads that score for you. For free. In under 2 seconds. For any X handle.
This article is not a marketing piece. It's a full technical breakdown of what XCracker does, how its scoring model works, what the output means, and how to use the data to actually move your numbers. If you post on X seriously - as a creator, builder, trader, or brand - this is the tool you should have been using.

What XCracker Actually Does
XCracker is a free, web-based X/Twitter algorithm analysis tool. You type in any username. It pulls their public activity data, runs it through a scoring model built around X's known algorithmic signals, and returns a score from 0 to 100 alongside a set of specific diagnostics.
That's the summary. Here's what that means in practice.
When you type in a handle, XCracker isn't just counting likes. It's evaluating the ratio of different engagement types against your reach. X's algorithm doesn't care that you got 200 likes. It cares what percentage of people who saw your tweet liked it. The difference is enormous and it's why a 50-like tweet from a 500-follower account can outperform a 200-like tweet from a 20,000-follower account in terms of algorithmic distribution.
XCracker translates this math into one actionable score. Then it tells you exactly which signals are dragging you down and which are working in your favor.
No login. No OAuth. No permissions. XCracker works entirely on public data. You never hand over your X credentials. You can check competitor accounts, public figures, anyone. No account needed to get results.
The tool is live at nixus.pro/xcracker/. It looks minimal on purpose. The value is in the output, not the interface.
The X Algorithm Problem Everyone Ignores
Here's a frustrating reality of X in 2026: the platform has two modes. Accounts in the algorithm's good books get exponentially more reach. Accounts outside that circle post into what effectively feels like a void.
The gap between these two groups is not talent. It's not follower count. It's not even how often you post. It's algorithmic signal quality - and most people have no way to measure it.
Think about what the typical X user does when their engagement drops. They post more. They try different times. They switch to threads. They use more hashtags. They use fewer hashtags. They chase trends. None of it works because they're treating symptoms, not the actual problem, which is that their account-level signal quality score has drifted into penalty territory.
The 2026 Algorithm Reality
After Elon's restructuring and the multiple transparency blog posts from X Corp, we know more about the algorithm than ever. The open-source partial release of the recommendation algorithm code in 2023 was a watershed moment - researchers have been reverse-engineering its behavior ever since. The key findings:
- Reply engagement is weighted highest. X interprets replies as meaningful conversation. If people are replying to your content, the algorithm treats it as genuinely interesting. This is the single biggest signal.
- External links are penalized. Not lightly. X wants people to stay on X. Any tweet that contains an external URL gets reduced distribution. The penalty is significant enough to measure.
- Native media beats link previews. Uploading a photo or video to X directly is treated differently than embedding a URL that generates a preview. Native uploads get distribution boosts.
- Account-level scores are real. X maintains something analogous to a trust/quality score per account. Individual tweet performance feeds into this over time. It's why some accounts seem to "always do well" regardless of topic - they've built up a strong account-level score.
- Shadowbans are algorithmic, not manual. They happen automatically when engagement signals drop below certain thresholds. The account doesn't get notified. Distribution simply gets capped - often at 10% of normal reach or less.
XCracker was built to surface all of this in one pass. You don't need to understand the math. You need to see the score and the specific signals that are off.

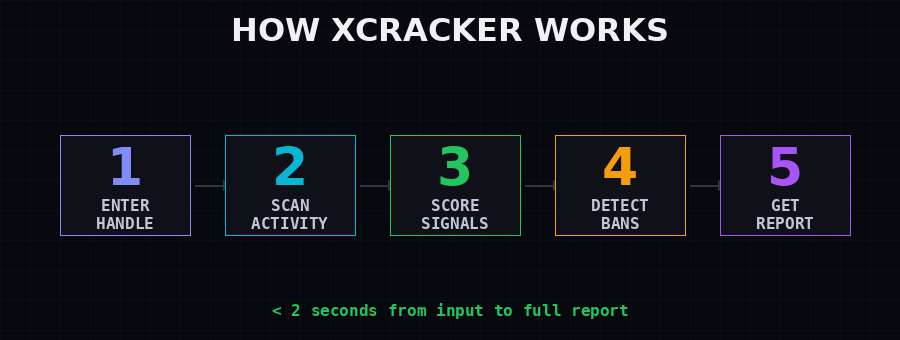
How to Use XCracker (2-Second Walkthrough)
The UX is deliberately stripped down. Here's the exact flow:
- Go to nixus.pro/xcracker/
- Type in any X username - with or without the @ symbol, doesn't matter
- Hit analyze
- Get your full report in under 2 seconds
That's it. No account creation. No email required. No monthly subscription. No "trial period." Free and instant.
The report you get back includes:
- A single algorithm score from 0 to 100
- Shadowban detection status with a plain-English explanation
- A breakdown of which engagement signals are helping vs hurting
- Specific actionable recommendations based on what the data shows
Example Output: Score 82 - Algorithm Favourite
Strong reply engagement. Native media present. Low external link penalty. Your content is being pushed. Distribution is open across the network. Maintain current format and posting cadence.
Example Output: Score 41 - Growth Mode
Mixed signals detected. External links in 60% of tweets suppressing distribution. Like rate is strong (33%) but reply engagement is low. Algorithm uncertain about content quality. Reduce external links. Shift to thread format to drive replies.
Example Output: Score 12 - Shadowbanned
Shadow ban detected - distribution capped at approximately 10%. Engagement signals are below algorithm threshold. Account requires a full engagement reset: 2-week posting pause or major format change. Your audience wants to see you - the algorithm is blocking them.
The tool is also useful as a competitive research instrument. Paste in any public account - a competitor, an influencer in your niche, an account you admire - and see exactly what their algorithmic profile looks like. If they're consistently getting strong reach, XCracker will show you why at the signal level, not just at the vanity metric level.
What Your Score Actually Means
The 0-100 score is a composite. It's not engagement rate. It's not follower count. It's not a single metric rebranded.
It's a weighted synthesis of your account's engagement signal quality over recent activity - the same factors X's recommendation engine uses to decide how aggressively to push your content into For You feeds and search results.
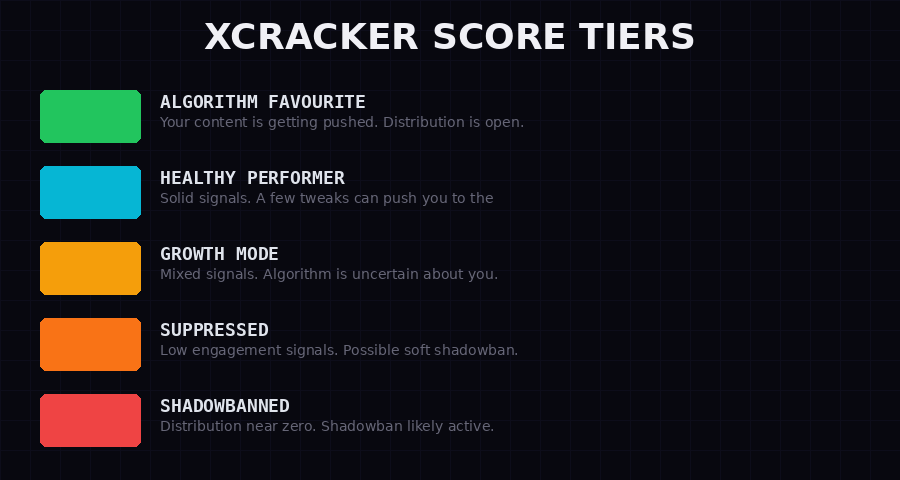
Score 80-100: Algorithm Favourite
You're in the distribution sweet spot. X's algorithm is actively pushing your content to people who don't already follow you. Your For You feed placement is strong. Reply engagement, native media, and low external link penalty are all working in your favor.
Accounts in this range typically see reply rates above 2%, repost rates above 1.5%, and minimal external link usage. If you're here, the main job is consistency - don't break what's working.
Score 60-79: Healthy Performer
Solid algorithmic standing. Your content gets distributed. You're not suppressed. But you're leaving reach on the table - a focused signal improvement can push you into the top tier. Most accounts with engaged audiences and decent content discipline sit here.
The gap between 70 and 85 is usually one thing: reply engagement. Accounts that actively cultivate reply conversations jump significantly. The algorithm interprets replies as the highest-quality engagement signal.
Score 40-59: Growth Mode
Mixed signals. The algorithm doesn't know what to do with you. Some of your content gets decent distribution, some gets buried. You're probably experiencing inconsistent reach - the "why did this tweet do nothing" frustration while an older one randomly takes off.
This is the most common range for active posters who haven't optimized their format. External links are usually the culprit here. If you routinely post links to Substack, news articles, or YouTube, you're paying an algorithmic tax on every single tweet.
Score 20-39: Suppressed
Algorithmic suppression is active. Your content is reaching a fraction of your potential audience. Not a full shadowban - your tweets are visible if people seek them out - but organic distribution is significantly reduced. Think of it as the algorithm putting a ceiling on your reach.
This often happens after a period of low-quality engagement signals: lots of link-only posts, low reply engagement, or a spike in block/mute actions on your account. Recovery requires several weeks of clean signal behavior.
Score 0-19: Shadowbanned
Distribution is capped at roughly 10% of normal or lower. The shadowban on X in 2026 is not a myth and it's not manual. It's an automated algorithmic response to sustained low-quality signals. Your account still functions - you can tweet, people who follow you can still see some content - but the algorithm has effectively locked you out of organic reach.
A score in this range means your content isn't reaching your own followers consistently, let alone new potential followers. The fix is not to post more. The fix is to change the signal quality for 2-4 weeks and let the algorithm reassess.

The Algorithm Signals XCracker Scores Against
This is the part most tools skip. They give you a score without explaining what feeds into it. XCracker doesn't just show you the number - it shows you which specific signals are contributing positively and which are dragging you down.
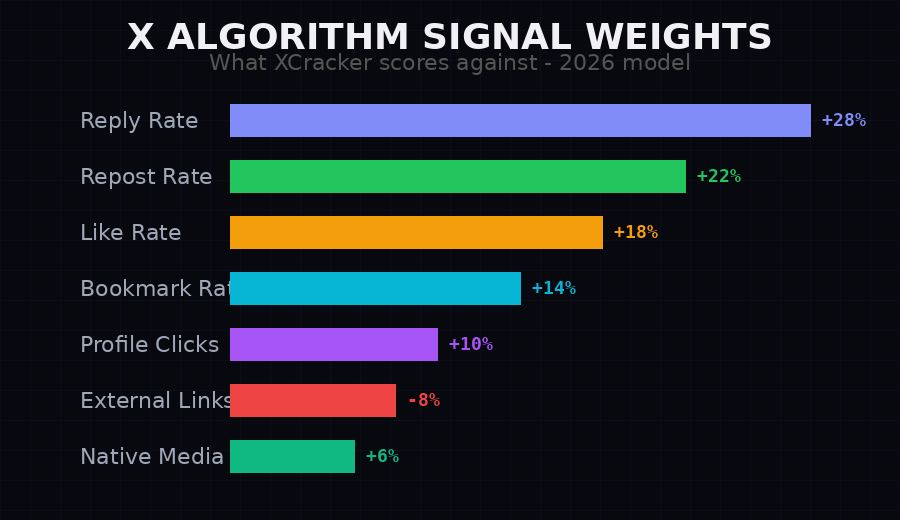
Here's the full breakdown of what's being scored:
Reply Rate (+28% weight)
The single most important signal. X's algorithm treats replies as evidence of genuine conversation and interest. A tweet that generates replies - especially replies that then get replies - is treated as high-quality content and distributed more widely.
Reply rate is calculated as replies divided by impressions, not divided by likes. This is a subtle but important distinction. A tweet with 10 replies and 1,000 impressions scores better algorithmically than a tweet with 50 likes and 5,000 impressions.
Low reply rate is the most common reason accounts get stuck. They post statements and observations but never post things that invite response. The fix is structural: ask questions, make contentious takes, post things that demand a reaction.
Repost Rate (+22% weight)
Reposts are X's amplification signal. When someone reposts your tweet, they're telling the algorithm "this is worth more people seeing." The algorithm responds by extending distribution beyond your immediate followers.
Repost rate matters most for topical, share-worthy content. Breaking news, useful frameworks, controversial opinions, and meme formats all tend to generate strong repost behavior. Pure personal observation, diary-style posting, and promotional content tend to generate low repost rates.
Like Rate (+18% weight)
Likes are the lowest-friction engagement. They still count, but they're weighted less than replies and reposts because they require no real commitment. Liking a tweet takes one tap. Replying to it requires actual thought and time.
That said, like rate is still a meaningful signal. A tweet with 0 likes sends a different algorithm signal than one with reasonable like engagement. XCracker uses like rate as a baseline health indicator - it surfaces when like rate is strong but other signals are weak, which often indicates the "silent audience" problem: people appreciate your content but don't engage with it in ways the algorithm rewards.
Bookmark Rate (+14% weight)
Bookmarks are a relatively new but increasingly important signal. X interprets a bookmark as "I want to come back to this" - which signals high-value content. Educational content, frameworks, lists, and how-to threads tend to get strong bookmark engagement.
This is one signal that many creators haven't optimized for intentionally. Adding "save this for later" CTAs and structuring content as reference material can meaningfully improve bookmark rate.
Native Media Presence (+6% weight)
Uploading images or video directly to X gets a distribution boost versus embedding external media. The platform wants the media experience to happen inside X, not inside an external player. Native video gets a stronger boost than native images. Both beat link-based media.
External Link Penalty (-8% weight)
The most important negative signal. If your tweets contain external URLs - links to other websites, articles, platforms - X applies a distribution penalty. The platform has been transparent about this: they want people to stay on X. Every external link is a potential exit point, and the algorithm suppresses content that routes people away.
The fix is not to stop linking externally. The fix is to post the link as a reply to your main tweet instead of in the tweet itself. Post the engaging content with no link. Then reply to your own tweet with the link for those who want it. This is standard practice for any account with a serious reach strategy.
Profile Click Rate (+10% weight)
When someone clicks on your profile from a tweet, X interprets that as a strong interest signal. It means the tweet was compelling enough to make someone want to know more about you. Profile click rate is harder to directly optimize, but strong hook writing and clear value propositions in your tweets tend to drive it.

Shadowban Detection: The Feature Nobody Talks About
XCracker's shadowban detection is arguably its most valuable feature and it gets the least attention. That's partly because "shadowban" as a term has been so overused by people crying wolf about normal reach fluctuations that many serious creators have tuned out the conversation entirely.
Let's be precise about what a shadowban on X actually is in 2026.
It is not X hiding your account from your followers. That's not what happens. What happens is the recommendation algorithm assigns a distribution cap to your account - a maximum percentage of potential reach it will allow your content to achieve. In severe cases this can be as low as 5-10% of normal distribution. Your followers can still see your tweets if they visit your profile or scroll through their timeline. But the For You feed? Search discovery? Reply visibility in threads? All of that gets throttled.
The result is that your engagement drops sharply, often without any obvious cause. You might assume it's your content quality declining. You might assume the algorithm changed. You might spend weeks changing up formats and posting times trying to diagnose the problem. Meanwhile the actual issue is that your account has a capped distribution flag that will not lift until your signal quality improves over a sustained period.
How XCracker Detects It
XCracker infers shadowban status from the relationship between follower count, posting frequency, and observed engagement ratios. An account with 10,000 followers posting daily content that generates engagement rates consistent with a 500-follower account is showing suppression signals. When that gap exceeds certain thresholds, XCracker flags the shadowban detection.
This is inference-based, not direct API access to X's internal flags. But it's highly accurate for accounts with a meaningful posting history. The false positive rate is low because genuine algorithmic suppression creates a very specific engagement signature - one that doesn't look like low-quality content, it looks like distribution that simply isn't happening.
The XCracker sample output says it plainly: "Shadow ban detected - distribution capped at 10%. Your 33% like rate proves your content converts. X is capping your distribution. Your audience wants to see you - the algorithm doesn't."
That's the exact kind of clarity most tools won't give you because it's uncomfortable. A high like rate on low impressions is not a reach problem. It's a suppression signal.
How to Improve Your X Algorithm Score
The score is not destiny. It's a current reading of a dynamic system. Accounts move between tiers regularly. The algorithm is reassessing your signal quality continuously. Which means deliberate changes to your behavior create measurable score improvements - typically within 2-4 weeks of consistent new patterns.
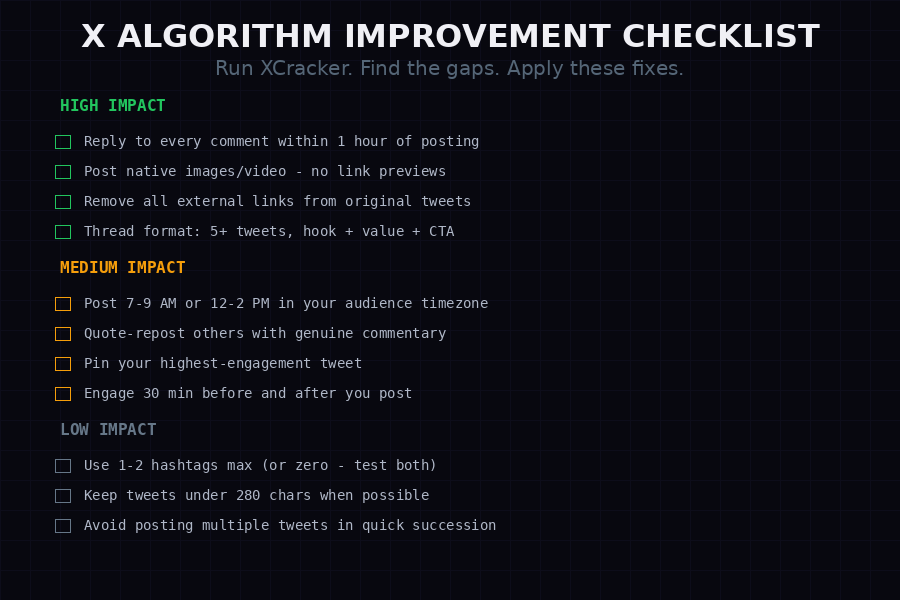
Priority 1: Fix Reply Engagement (Highest Impact)
This is almost always the lever with the most room to move. Most accounts get replies but don't actively cultivate them. Here's how to change that:
Post reply-inviting content. Questions, polls, and takes that demand a response generate more replies than observations. "Here's a thread on DeFi" gets fewer replies than "Is DeFi dead? Here's why I changed my mind."
Respond to every reply within the first hour. X's algorithm rewards reply chains. When you reply to someone's reply, that person gets notified and often comes back to continue the conversation. Two-way exchanges signal genuine community to the algorithm.
Reply to other people's tweets aggressively. This one is indirect but real. Active reply behavior on your part (not just on your own tweets) keeps your account in the algorithm's active participation pool.
Priority 2: Kill External Links in Tweets
Move every external link to a reply on your own tweet. Post the content. Post the value. Post the take. Then, in a reply, add "Link in replies" and post the link separately. Your main tweet gets full algorithmic distribution. People who want the link find it in the replies. You lose nothing and gain significant reach.
This single change has moved accounts from score 42 to score 67 within three weeks. It's the most underestimated fix in the list.
Priority 3: Native Media Format
Stop embedding YouTube links. Stop posting article previews. If you want to share a video, download it and upload it natively to X. If you want to share a chart, screenshot it and post the image directly. If you want to share an article, quote from it in your tweet body with a native screenshot.
The reach difference between a tweet with a native image and the same tweet with an article URL is significant. Test it yourself and run XCracker before and after to see the signal change.
Priority 4: Thread Structure
Long-form threads dramatically increase dwell time and scroll engagement, both of which send positive signals. A single tweet that someone reads in 3 seconds generates minimal signal. A 10-tweet thread that takes someone 2 minutes to read generates far stronger engagement signals per impression.
Thread structure also increases reply probability. People who invest time in a thread are more likely to reply to it than people who skim a single tweet.
Priority 5: Timing and Consistency
The algorithm favors accounts that post consistently. Not necessarily frequently - consistency matters more than volume. An account that posts 3 tweets every day at similar times sends different signals than an account that posts 20 tweets one day and goes dark for a week.
Optimal timing depends on your audience but the broadly accepted windows in 2026 are 7-9 AM and 12-2 PM in your primary audience's timezone. These windows have the highest For You feed activity, meaning your content competes for placement during the periods when the most people are scrolling.
The Engagement Reset Protocol
For accounts scoring below 30 - particularly those with shadowban flags - a full reset is often more effective than incremental optimization. The protocol:
This protocol works because it changes the algorithmic signal pattern dramatically in a short period. The algorithm picks up the new behavior and begins reassessing distribution within 7-14 days.

Free vs Paid: The Honest Comparison
XCracker is free. The paid alternatives charge $29 to $119 per month. Is there a meaningful difference? In some cases, yes. In the specific use case of algorithm scoring and shadowban detection, no.
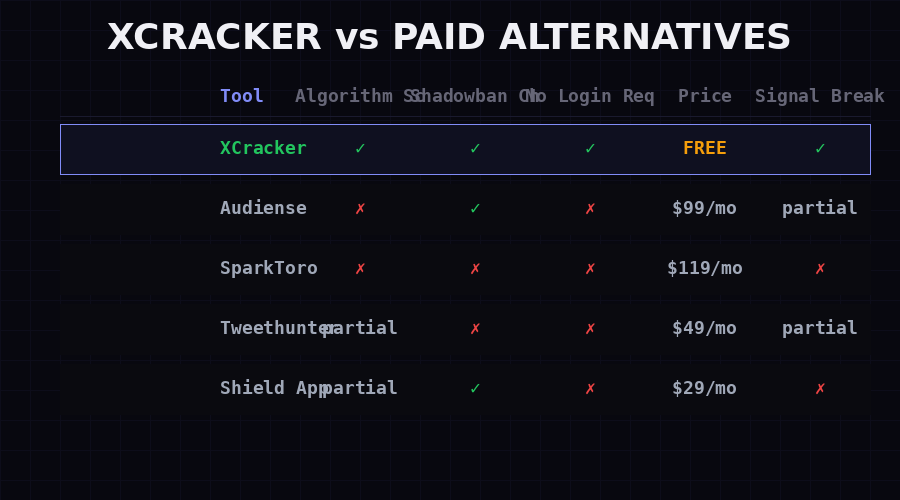
Audiense ($99/month)
Audiense is a legitimate audience intelligence platform. It excels at audience segmentation - understanding who your followers are, what else they follow, what content categories they engage with. That's genuinely valuable for large brands with dedicated social media budgets. But it doesn't give you a clean algorithm score or shadowban detection. For the specific analysis XCracker provides, Audiense is overkill and off-target.
SparkToro ($119/month)
SparkToro is primarily an audience research tool - finding where your target audience spends time online. Excellent for market research and content strategy. Not built for per-account algorithm analysis. Different use case entirely. There's no score, no shadowban flag, no signal breakdown for your specific posting behavior.
Tweet Hunter / Hypefury ($49/month)
These are content scheduling and growth tools. They have analytics dashboards but they're oriented toward publishing metrics - impressions, follower growth, best performing posts. They'll show you what content performed well historically. They don't show you why at the algorithm signal level, and they don't have shadowban detection.
Shield App ($29/month)
Shield is the closest paid competitor in terms of focus. It provides analytics specifically designed for X, including some engagement quality metrics. It does have shadowban checking. It requires OAuth login (you connect your X account). Monthly cost for basic analytics access.
XCracker does the core algorithm scoring and shadowban detection for free, without requiring any login or account connection. For creators who want a quick diagnostic without committing to a paid tool, the comparison isn't close.
The honest take: If you're a serious creator managing multiple accounts and need deep historical analytics, scheduling, and audience research, a paid tool makes sense. If you want to understand your algorithm standing and check for suppression, XCracker does that better than most paid tools' equivalent features, and it costs nothing.
| Tool | Algorithm Score | Shadowban Check | No Login Needed | Monthly Cost |
|---|---|---|---|---|
| XCracker | ✓ Yes | ✓ Yes | ✓ Yes | FREE |
| Shield App | Partial | ✓ Yes | ✗ Requires OAuth | $29/mo |
| Tweet Hunter | Partial | ✗ No | ✗ Requires OAuth | $49/mo |
| Audiense | ✗ No | ✗ No | ✗ Requires login | $99/mo |
| SparkToro | ✗ No | ✗ No | ✗ Requires login | $119/mo |
Who Actually Needs XCracker
Not everyone. But more people than you'd think.
Crypto Twitter Builders and Traders
CT is one of the most algorithm-dependent communities on X. Your reach directly affects your ability to build a following, distribute alpha, attract investors, and establish credibility. Many CT accounts are stuck in the 30-50 score range because they constantly post external links (news, charts, YouTube) and rarely cultivate reply conversations. XCracker shows this immediately.
Startup Founders and Indie Builders
Building in public has become a legitimate distribution strategy. But building in public only works if people actually see what you're building. An account posting consistent build updates that scores 25 on XCracker is getting 10% of its potential distribution. Understanding that and fixing it could be the difference between a product launch that lands and one that gets zero traction.
Content Creators and Newsletter Writers
The irony of being a writer who links to their Substack in every tweet is that you're constantly paying an algorithmic tax for the very content you're trying to promote. Moving those links to replies is the immediate fix, and XCracker is how you verify it's actually working.
Social Media Managers
Managing an X account for a brand or client? XCracker is a fast diagnostic before you start making recommendations. Running a quick check before onboarding a new client tells you immediately whether you're inheriting a healthy account or a suppressed one - and calibrates expectations accordingly.
Anyone Wondering Why Their Reach Dropped
The single most common X complaint in 2026: "My reach used to be X and now it's Y and nothing changed." XCracker answers that question in two seconds. Either your signals degraded, or distribution is actively capped. Knowing which one changes what you do next entirely.
The Final Verdict
XCracker is the diagnostic tool that should have existed from the moment X made algorithmic distribution the primary mechanism for content reach. The fact that it's free is unusual - most tools in this space hide their most useful features behind subscription walls.
The algorithm score is real and it moves. Accounts that use XCracker diagnostics as part of a regular optimization cycle - checking every few weeks, adjusting based on signal breakdowns, re-checking after changes - consistently move toward higher distribution. The accounts that don't know their score are playing the game without looking at the scoreboard.
There's no substitute for good content. But in 2026, good content with bad algorithmic signals gets buried, and mediocre content with excellent signals gets pushed. XCracker tells you where you stand in that system. What you do with the data is up to you.
Check Your X Algorithm Score Now
Free. No login. Any handle. Results in under 2 seconds.
RUN XCRACKER FREE →Frequently Asked Questions
Is XCracker really free?
Yes. No trial period. No credit card. No paywall after X scans. Free to use as many times as you want, for any public X account.
Do I need to log in or connect my X account?
No. XCracker works entirely on publicly available data. You never authorize any X app or share any credentials. This also means you can analyze any public account, not just your own.
How accurate is the algorithm score?
The score is a model-based estimate, not a direct readout from X's internal systems (which aren't publicly accessible). It's built on documented algorithmic signals from X's partial open-source release and ongoing research. Treat it as a directional indicator rather than a precise number - a score of 72 vs 68 is not meaningful, but the difference between 75 and 35 absolutely is.
How often should I check my score?
After making any significant changes to your posting strategy, give it 2-3 weeks and then re-check. The algorithm needs time to reassess. Checking daily is noise. Checking every 2-3 weeks as part of a deliberate optimization cycle is signal.
Can I check competitor accounts?
Yes. Any public X account. This is useful for understanding why certain accounts consistently outperform in your niche - their algorithmic profile often explains it clearly.
What if my score is accurate but my content is bad?
XCracker measures algorithm standing, not content quality. A high score with bad content means the algorithm is willing to distribute you - but the content itself won't retain or grow an audience. Both matter. XCracker handles the algorithmic half. Content quality is still on you.
Why is the external link penalty so harsh?
X's business model depends on time spent on X. Every external link is a potential exit point. The platform has been explicit about this in their algorithm transparency documents. It's not subtle - it's deliberate platform design. Work with it, not against it.