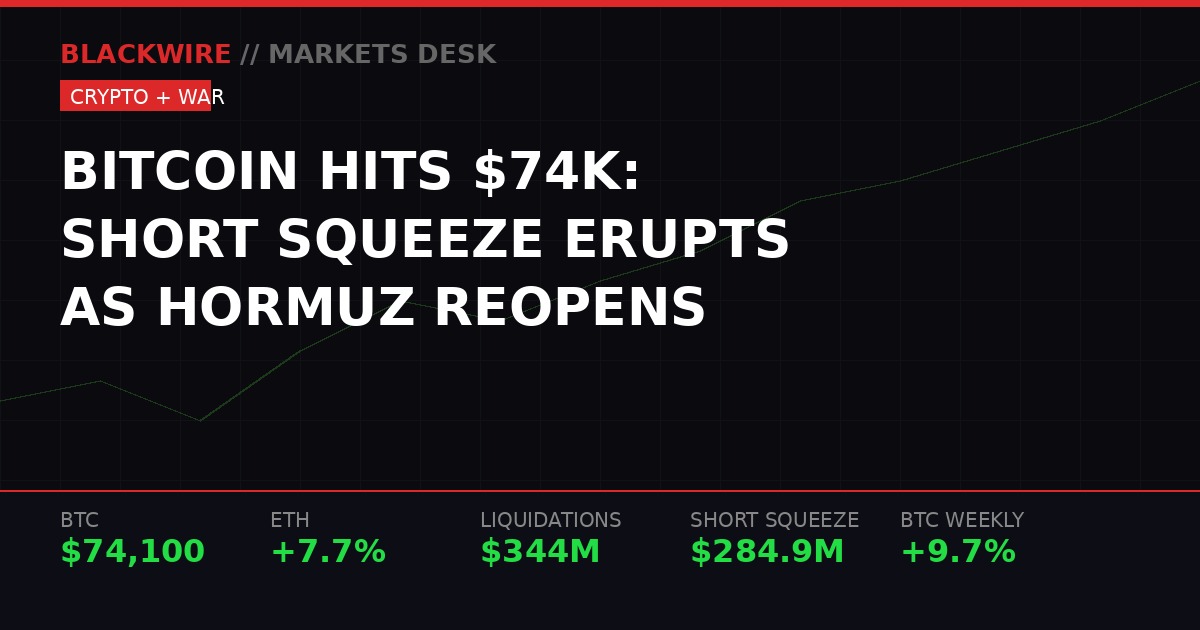
Bitcoin briefly broke $74,000 on Monday morning, March 16, 2026, delivering its largest weekly gain since September 2025. (BLACKWIRE)
Two tankers carrying liquefied petroleum gas to India crossed the Strait of Hormuz on Sunday night. That was it. That was the catalyst. Two commercial vessels sailing through a waterway that had been fully closed to non-military traffic for sixteen days triggered a three hundred and forty-four million dollar liquidation cascade that systematically wiped out bearish positions across every major cryptocurrency and sent Bitcoin briefly above seventy-four thousand dollars for the first time in two weeks.
The numbers from CoinGlass are unambiguous. Short liquidations accounted for two hundred and eighty-four point nine million dollars of the total - eighty-three percent of all forced closures in the past twenty-four hours. Over ninety-one thousand nine hundred and seventy-eight individual trading accounts were blown out. Ethereum shorts alone absorbed one hundred and twenty-seven point nine million dollars in forced losses. Bitcoin shorts followed at one hundred and twenty-four point five million dollars. Solana shorts added another eighteen point five million to the final tally. The largest single liquidation of the session: a six point nine four million dollar Bitcoin position on Bitfinex that evaporated in a single automated order.
Those are not edge cases or retail traders getting squeezed out. Those figures represent institutional traders, professional funds, and sophisticated market participants who had spent the past two weeks building short positions based on what looked like an airtight thesis: war means risk-off, oil above one hundred dollars means inflation, inflation means the Fed cannot cut rates, no rate cuts means liquidity stays tight, tight liquidity means crypto underperforms. The logic was correct. The market was wrong. Bitcoin did not care.
The Anatomy of a War Short Squeeze
A short squeeze operates on a simple mechanical principle: shorts get forced to buy, that forced buying pushes prices higher, which triggers more liquidations, which forces more buying, which pushes prices higher still. The process continues until the marginal short has been wiped out and a new equilibrium is found at a higher price. Understanding why Monday's squeeze reached this scale requires understanding how the past two weeks of war trading set up the conditions for it.
When the United States and Israel launched coordinated strikes on Iran on Saturday, February 28th, Bitcoin was the only liquid financial market on the planet. Stock markets were closed. Forex trading was minimal. Bond markets were shut. Bitcoin was open, and it responded immediately, dropping eight point five percent to sixty-four thousand dollars in a single session. That price action established the initial short thesis: Bitcoin sells on war headlines, therefore being short Bitcoin during a war makes money.
That thesis was reinforced over the next two weeks as each escalation brought another brief selloff. Every time Iran fired retaliatory missiles at Gulf states, Bitcoin dropped. Every time Trump warned about further strikes, Bitcoin retreated. The pattern felt reliable. Professional traders built layered short positions, confident that the next escalation would deliver another leg down. Perpetual futures funding rates turned negative, meaning short sellers were actually being paid a daily fee to maintain their bearish bets. That is the derivatives market's way of saying: the crowd is overwhelmingly short and willing to pay for the privilege.
But there was a problem with the short thesis that became visible only in retrospect. Each selloff was finding buyers at a progressively higher price. The floor was rising even as the war escalated. That pattern - which CoinDesk analysts had been documenting since March 7th - meant that bears were not actually in control of the market. They were being absorbed by buyers who saw the war as a buying opportunity, not a reason to flee. When the Hormuz headline broke Sunday night, those accumulated short positions had nowhere to go but liquidated.
The lopsided ratio confirms this was structural, not accidental. Eighty-three percent of liquidations being short means this was not a two-sided move where both longs and shorts got caught in volatility. This was a targeted, directional destruction of one side of the market. The single six point nine four million dollar Bitfinex liquidation represents a single institution or professional trader who had built a leveraged short position expecting Bitcoin to break below seventy thousand dollars. They were wrong by roughly six percent in the wrong direction, and their position was closed automatically.
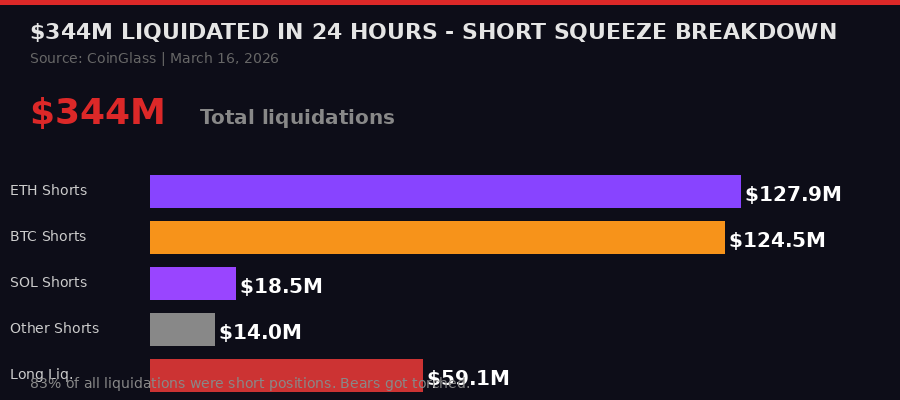
Liquidation breakdown by asset, 24 hours ending March 16, 2026. ETH and BTC shorts absorbed the most damage. Source: CoinGlass via BLACKWIRE.
Five War Floors, Five Higher Lows - The Rising Support Pattern That Called the Squeeze
The data pattern that made Monday's move predictable in hindsight is one of the cleanest technical stories in recent market history. Every single major escalation in the Iran conflict triggered a Bitcoin selloff. And every single one of those selloffs found buyers at a higher price than the previous one. This is not coincidence. This is a structural change in how Bitcoin is being held and traded.
February 28th, the day of the initial U.S.-Israel strikes on Iran: Bitcoin drops eight point five percent and bottoms at sixty-four thousand dollars. This is the war's first price shock. Panic selling, fear, the 24-7 nature of crypto markets being the only outlet for geopolitical anxiety. The low is sixty-four thousand.
March 2nd: Iran retaliates with ballistic missiles targeting Gulf state infrastructure. Oil spikes six percent in a single session, the largest single-day oil move since the Gulf War. Global equity markets are in turmoil. Bitcoin's floor: sixty-six thousand dollars. That is two thousand dollars higher than the February 28th low. Buyers stepped in two thousand dollars above where they bought the first selloff.
March 7th: The conflict enters its second week with sustained bombardment from both sides. The U.S. dollar posts its steepest weekly gain in over a year, meaning traditional safe-haven demand is pulling capital away from risk assets. Bitcoin absorbs the pressure and finds its floor at sixty-eight thousand dollars. Another two thousand dollar improvement from the March 2nd bottom.
March 12th: Tanker attacks in the Persian Gulf. Commercial shipping companies begin rerouting vessels around the Strait of Hormuz. The International Energy Agency convenes emergency sessions and labels the disruption the largest oil supply shock in recorded history, surpassing the 1973 oil embargo in terms of instantaneous impact. Bitcoin holds sixty-nine thousand four hundred dollars. The floor keeps rising.
March 14th: Trump authorizes strikes on Kharg Island, Iran's primary oil export facility responsible for approximately ninety percent of Iran's crude oil revenue. This is the most aggressive escalation yet - targeting energy infrastructure directly. Trump later says he spared it at the last moment "for reasons of decency" but warns he will "immediately reconsider" if Iran keeps blocking the strait. Bitcoin's low for the session: seventy thousand five hundred and ninety-six dollars.
Five escalations. Five floors. Each floor higher than the last by one thousand to two thousand dollars. The compression was mathematical and visible to anyone tracking it. The ceiling at seventy-three to seventy-four thousand dollars had now rejected Bitcoin four times. Something had to give. The question was direction. On Monday morning, two tankers crossing the Strait of Hormuz answered that question.
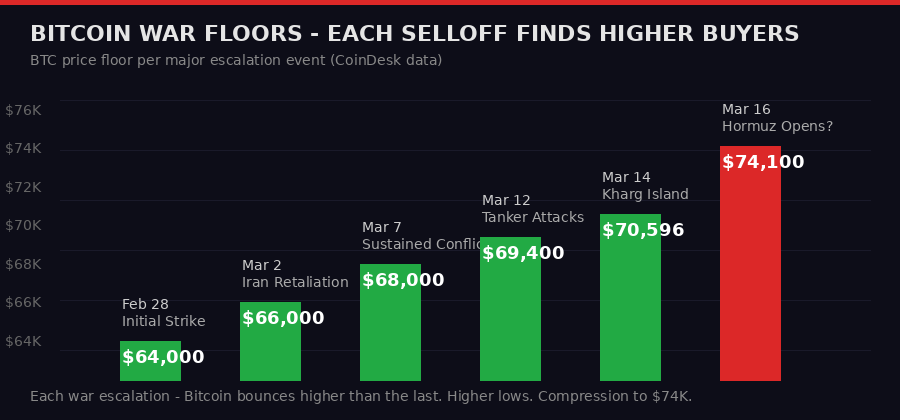
Bitcoin's floor price following each major Iran conflict escalation, February 28 to March 16, 2026. Higher lows on every single event. Source: CoinDesk data, BLACKWIRE chart.
War and Bitcoin - Full Timeline
What the Altcoin Surge Is Actually Telling You About Market Structure
The Bitcoin price headline is the loudest signal, but the altcoin performance data is the most important one for understanding what is actually happening in market structure. When altcoins outperform Bitcoin during a weekly recovery, it is not a random event. It is a specific behavioral pattern that professional traders use to assess the quality and depth of a market move.
The weekly numbers are striking. Ethereum gained fourteen point three percent over the seven days ending March 16th, outperforming Bitcoin by four point six percentage points. Solana gained twelve percent, outperforming Bitcoin by two point three points. These are not marginal differences - these are significant rotational signals. XRP climbed eight point nine percent. Dogecoin hit ten cents for the first time since early March, up ten point six percent on the week. BNB gained nine point five percent to six hundred and eighty-three dollars.
In crypto market analysis, the pattern where altcoins significantly outperform Bitcoin on a weekly basis has a specific interpretation: capital is rotating down the risk curve. Investors are not buying Bitcoin as a defensive position and stopping there. They are actively moving into higher-beta, higher-volatility assets, which means their risk tolerance has expanded. That expansion of risk appetite is incompatible with a market that is primarily fear-driven.
The contrast with what the macro backdrop says should be happening is worth sitting with. The Federal Reserve meets on March 17th and 18th. Brent crude oil was trading around one hundred and four dollars per barrel as of Monday morning, down from the intraday high of one hundred and six point fifty but still historically elevated. The two tanker crossings of the Strait of Hormuz were commercial vessels bound for India - the Iranian Foreign Minister clarified the strait was closed only to ships from "enemies," not to neutral trade partners like India. Tehran simultaneously denied requesting talks or a ceasefire even as Trump said negotiations were underway.
None of that looks like a resolution. Yet the market has acted like one is coming. The crypto fear and greed index remained in "extreme fear" territory even as prices climbed through the week. Perpetual futures funding rates stayed negative through most of the move. The divergence between sentiment indicators showing maximum fear and price action showing maximum strength is the fingerprint of a genuine short squeeze rather than an organic bull move - but the altcoin participation suggests real capital rotation on top of the forced buying.
"Geopolitical tension strengthens the Bitcoin thesis. In uncertain times, investors look for neutral stores of value, and Bitcoin increasingly sits in that bucket alongside gold." - Mati Greenspan, founder, Quantum Economics, quoted in CoinDesk, March 15, 2026
The correlation breakdown with technology stocks adds another dimension. Using BlackRock's iShares Bitcoin Trust as a five-day proxy, IBIT gained roughly three point five percent this week and approached a one-month high on Friday. Over the same period, the iShares Expanded Tech Software ETF, gold, and U.S. equities all trended lower. Bitcoin has now gained roughly thirteen percent since the start of the conflict, outperforming traditional risk assets and classic safe havens alike. Only oil and the U.S. dollar - both direct beneficiaries of the war itself - have done better over the same period. That is a remarkable comparison set.
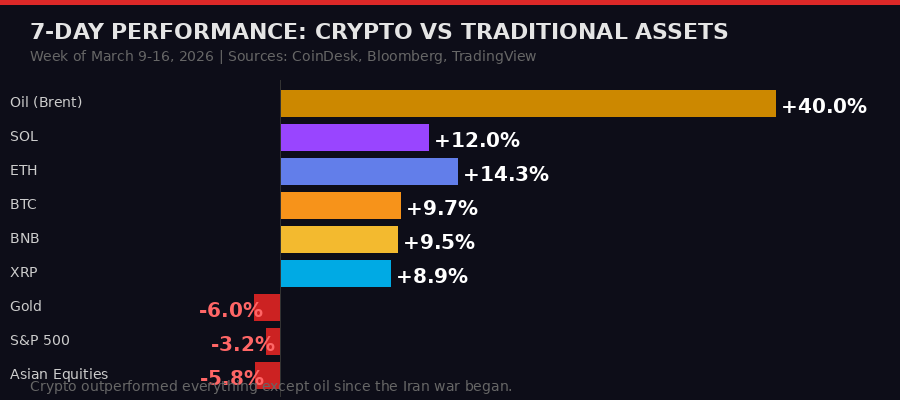
7-day performance comparison across major asset classes, week of March 9-16, 2026. Bitcoin gained 9.7%. ETH gained 14.3%. Gold and equities declined. Source: CoinDesk, Bloomberg, TradingView via BLACKWIRE.
The Federal Reserve Meeting That Could Reset Everything
The Federal Open Market Committee convenes on March 17th and 18th. The Wednesday press conference and dot plot release will be the single most important macro event for crypto markets in months. Understanding what is at stake requires understanding how dramatically the context for this meeting has changed in the past forty-eight hours.
One week ago, the Fed meeting looked completely scripted. Oil was above one hundred dollars per barrel, threatening to push U.S. inflation back above four percent on an annualized basis. The war was showing no signs of de-escalation. Every Fed official who had spoken publicly had signaled that rate cuts were off the table while energy prices remained elevated and geopolitical uncertainty persisted. The interest rate futures market had priced out virtually all cuts for 2026.
That calculus has shifted. Brent crude pulled back from one hundred and six point fifty to around one hundred and four dollars as the Hormuz headlines broke. WTI dropped below one hundred dollars. If the strait remains partially open - even to neutral-country shipping - the IEA's catastrophic supply disruption scenario becomes materially less severe. Less supply disruption means lower energy prices. Lower energy prices mean less inflationary pressure. Less inflationary pressure means more room for the Fed to cut rates.
The dot plot on Wednesday will show where each Fed official believes rates will be at the end of 2026 and 2027. If the median dot signals even one rate cut for 2026 - which would have been unthinkable before the Hormuz softening - crypto markets will interpret that as a green light for continued liquidity expansion. Bitcoin's rally would likely continue. If Powell signals that rate cuts require oil falling to ninety dollars or below and sustained de-escalation evidence, the rally faces an immediate test.
The institutional money flows into Bitcoin ETFs suggest large investors are already positioning for a Fed pivot. U.S. spot Bitcoin ETFs recorded approximately one point three billion dollars in net inflows so far in March, according to SoSoValue data cited by CoinDesk. That would make March the first month of net ETF inflows since October 2025. Critically, that one point three billion dollars came in during active wartime - not after the war ended, not after the Hormuz softening, but during the height of the conflict when fear was at maximum and prices were below seventy thousand dollars. Institutions were buying the war, not the peace.
That behavioral pattern - institutional buying during maximum fear, during wartime, at prices that retail sentiment indicated were too risky - is the primary reason Bitcoin's floor kept rising through the conflict. The weak hands sold on each escalation. The strong hands absorbed every one of those sales. The short squeeze on Monday was the mechanical aftermath of that structural imbalance becoming visible in the price.
Regulatory Clarity Arriving - SEC and CFTC End the Turf War
Lost in the noise of the war and the short squeeze is a regulatory development that could matter more to Bitcoin's long-term trajectory than any single price move. The U.S. Securities and Exchange Commission and the Commodity Futures Trading Commission signed a formal memorandum of understanding last week, publicly ending years of jurisdictional conflict over which agency controls which parts of the crypto market. This is not a minor procedural update. It is the foundational document for how crypto regulation in the United States gets built from here.
The two agencies had been in open conflict for years over whether specific tokens were securities under the SEC's jurisdiction or commodities under the CFTC's. That ambiguity created a regulatory vacuum where crypto companies operated without clarity, enforcement was unpredictable, and institutional capital stayed cautious because the rules could change depending on which regulator decided to act first. The Gensler era at the SEC was characterized by aggressive enforcement actions that the industry viewed as regulation by lawsuit rather than regulation by rulemaking.
Under the new MOU, the agencies commit to coordinating their approaches to digital asset oversight, holding joint meetings, sharing data, and most importantly, issuing joint product definitions. That last point is the one the industry cares about most. "Clarify product definitions through joint interpretations and rulemakings," the document states directly. This means the years-long debate over whether specific tokens are securities or commodities will be resolved through formal rulemaking rather than through litigation and enforcement actions.
"More than aligning our rules, a harmonized framework also demands coordinating our responses to the firms that operate within it, including those that have questions of interpretation or request exemptive relief." - SEC Chair Paul Atkins, prepared remarks, week of March 9, 2026
The broader market structure bill working its way through the Senate adds context. Senate Majority Leader John Thune told Punchbowl News that he does not expect the bill to move through the Senate before the April legislative calendar, and Congress is about to enter a two-week Easter break. So formal statutory clarity is still months away at minimum. But the SEC-CFTC MOU is significant precisely because it does not require Congressional action - it is an executive branch coordination agreement that creates the regulatory architecture regardless of what Congress does with legislation.
Australia added its own piece to the global regulatory convergence this week. The Senate Economics Legislation Committee endorsed the Corporations Amendment Digital Assets Framework Bill 2025, which would bring cryptocurrency platforms and custody providers under Australia's existing financial services framework. The legislation would create a licensing and compliance regime for digital token managers by amending the Corporations Act and the ASIC Act. Australia is not the United States, but regulatory clarity in a G-20 economy signals a global trend moving in one direction: formal recognition and oversight, not prohibition.
Tokenized Treasuries Cross $11 Billion - The Quiet Institutional Accumulation
While Bitcoin absorbs all the headlines, a different market crossed a threshold this week that institutional finance is watching more closely than crypto media has covered. The tokenized United States Treasury market hit a fresh record high of over eleven billion dollars, according to RWA.xyz data cited by CoinDesk on March 13th. The sector has added roughly two point five billion dollars in market value - a twenty-seven percent gain - since the start of the year, growing even as crypto prices were collapsing during the war's first weeks.
The leadership of that market just changed hands. Circle, best known as the issuer of the USDC stablecoin, has become the largest provider of tokenized Treasury exposure after its USYC token expanded to approximately two point two billion dollars in supply. That growth pushed USYC past BlackRock's USD Institutional Digital Liquidity Fund, known as BUIDL and issued in partnership with tokenization specialist Securitize, which currently holds around two billion dollars in assets. BUIDL's market share collapsed from a peak of forty-six percent in May 2025 to eighteen percent today as competition intensified.
Circle's path to that top position is instructive. The company acquired Hashnote, the original issuer of USYC, in early 2025 and immediately gained access to institutional relationships built around Treasury tokenization. The growth accelerator turned out to be Binance. Since July 2025, USYC supply on BNB Chain swelled to one point eight four billion dollars after Binance introduced the token as off-exchange collateral for institutional derivatives trading. Under the structure, institutions hold their capital in USYC - earning Treasury yields - while using it as margin for crypto derivatives trading. That is a capital efficiency improvement that traditional finance cannot match: earn T-bill rates while maintaining full trading collateral flexibility.
"Tokenized treasuries and repo as collateral is a major emerging use case and we are proud of how quickly this has grown." - Jeremy Allaire, CEO, Circle, post on X, March 14, 2026
The growth pattern during the war is particularly relevant. The tokenized Treasury market gained value during the same weeks that Bitcoin and crypto broadly were selling off. That inverse relationship suggests institutional participants were rotating: parking capital in yield-bearing tokenized Treasuries while waiting for the war-driven volatility to clear, then redeploying into risk assets when conditions improved. If that interpretation is correct, the eleven billion dollars sitting in tokenized Treasuries represents potential dry powder for risk assets including Bitcoin. As the Hormuz situation de-escalates and the macro picture brightens, some portion of that capital could rotate back into higher-beta crypto positions.
The $1 Million Bitcoin Thesis Gets Its Best Evidence Yet
The recurring headline before the squeeze was Bitwise CIO Matt Hougan's revisited argument for Bitcoin reaching one million dollars per coin. The call is not new in crypto circles - Eric Trump doubled down on it in February, Coinbase CEO Brian Armstrong said it by 2030, Jack Dorsey put a five-year timeline on it, Arthur Hayes said 2028, Cathie Wood's Ark Invest projected three point eight million dollars by the end of the decade, and Bernstein forecasted one million by 2033. The number has become a Rorschach test for how seriously someone takes Bitcoin's long-term trajectory.
Hougan's framework is a market share argument rather than a momentum or technical one. The global store-of-value market - encompassing gold, government bonds, and other assets people hold primarily to preserve wealth rather than generate income - expanded from roughly two point five trillion dollars in 2004 to nearly forty trillion dollars today. Bitcoin represents approximately four percent of that market at current prices around seventy-four thousand dollars per coin. If Bitcoin captured roughly half of that forty trillion dollar market over the next decade, the math produces a price around one million dollars per coin. The denominator need not be static - if the total store-of-value market grows further, Bitcoin needs an even smaller share to reach that price.
What makes the Iran war relevant to this thesis is the behavioral data it generated. Bitcoin was the first asset to price the war's beginning. It was open at 2 AM on a Saturday when the strikes began and took an eight point five percent hit before any other market could react. Two weeks later, it has outperformed gold, U.S. equities, European equities, and Asian stock markets. The only assets that beat Bitcoin over this period are oil and the U.S. dollar, both of which are direct mechanical beneficiaries of the war itself. A store-of-value asset should hold and recover during geopolitical stress. Bitcoin has done exactly that, in front of the entire institutional world.
"Many investors make a 'static denominator' mistake, valuing bitcoin against today's store-of-value market instead of a much larger future one. The real question is not whether $1 million bitcoin is theoretically possible, but whether institutional adoption compounds long enough to justify that price." - Jason Fernandes, co-founder, AdLunam, quoted in CoinDesk, March 15, 2026
The institutional inflow data is the most concrete support for the compounding adoption argument. One point three billion dollars in U.S. spot Bitcoin ETF net inflows during the active wartime phase of March 2026 - not during a bull market, not after a resolution, but while oil was at one hundred and ten dollars and global equity markets were bleeding - represents a qualitative shift in how institutional capital treats Bitcoin. Five consecutive months of net ETF outflows ended when the war was at its worst. Institutions bought the dip when every sentiment indicator said maximum fear. That is long-term holder behavior, not speculative trading.
Three Scenarios for the Week Ahead
The squeeze has cleared the field of the most aggressive shorts. What happens next depends on which of three macro paths materializes over the next seven to ten days. The variables are the Strait of Hormuz, the Federal Reserve meeting on March 17th and 18th, and whether the diplomatic back-channel between the U.S. and Iran that Trump referenced - and Tehran denied - actually exists and produces movement.
The bull case looks like this: More commercial vessels cross the Hormuz over the coming days, establishing a de facto partial reopening for neutral-country shipping. Iran's conditional language about the strait being closed only to "enemies" becomes the operating framework. Oil falls from one hundred and four dollars toward ninety dollars. The Fed signals on Wednesday that the updated inflation trajectory allows for one or two rate cuts in the second half of 2026, reversing the complete removal of cuts that the market priced in during the war's first weeks. Bitcoin tests the eighty thousand dollar level, Ethereum pushes toward two thousand five hundred dollars, and the altcoin rotation that started Monday accelerates further. The one point three billion in ETF inflows seen in March becomes two billion. This requires the macro pieces to keep moving in the right direction.
The base case: The Hormuz situation stabilizes but does not fully resolve. Oil holds around one hundred dollars. The Fed holds rates on Wednesday but signals conditional flexibility - cuts possible if oil falls further, but not committed to a timeline. Bitcoin consolidates between seventy thousand and seventy-six thousand dollars. The altcoin rally fades as speculative momentum exhausts. Markets wait for the next concrete development from Tehran or Washington. Range trading with elevated volatility is the central scenario here.
The tail risk: Iran closes the Hormuz completely in direct retaliation for the Kharg Island strikes, executing the threat it issued on March 14th to attack U.S.-linked facilities if energy infrastructure is targeted. Oil spikes back above one hundred and ten to one hundred and fifteen dollars. The Fed emergency language around stagflation risks surfaces at the press conference. Risk assets dump hard across the board. Bitcoin could retest sixty-eight thousand to seventy thousand dollars, this time with materially less buying support because the short squeeze has removed the most aggressive bears from the field. The next selloff might not find as resilient a bid.
The asymmetry matters for positioning. Bears need all three of their scenarios to materialize simultaneously - Hormuz closes, Fed turns hawkish, diplomacy fails - to justify rebuilding short exposure at current levels. Bulls need only one of those scenarios to not happen. The Hormuz evidence from Sunday suggests even partial reopening is sustainable. That asymmetry, combined with the institutional buying during the war and the regulatory clarity emerging from Washington, is why Monday's squeeze was directionally predictable even if the timing and magnitude were not.
Bitcoin's answer to what happens next will come before any other asset has a chance to price it. That is what two weeks of war trading has confirmed about its structural role in global markets. When the next headline breaks - at 2 AM on a weekend, during a national holiday, in the middle of a central bank blackout window - Bitcoin will move first. Every other asset class will follow. That is not just a trading edge. That is a structural argument for why seventy-four thousand dollars is not the ceiling.
Get BLACKWIRE reports first.
Breaking news, investigations, and analysis - straight to your phone.
Join @blackwirenews on Telegram