Bitcoin Hits $73,800 While USDC Finally Flips Tether: Friday's Crypto Market Explosion, Mapped
Short squeeze ignition, a stablecoin power shift seven years in the making, XRP breaking a months-long cage, and Pi Network pumping 30% despite Bybit calling it a scam last year. Everything that moved on March 13, 2026 - and why it matters.
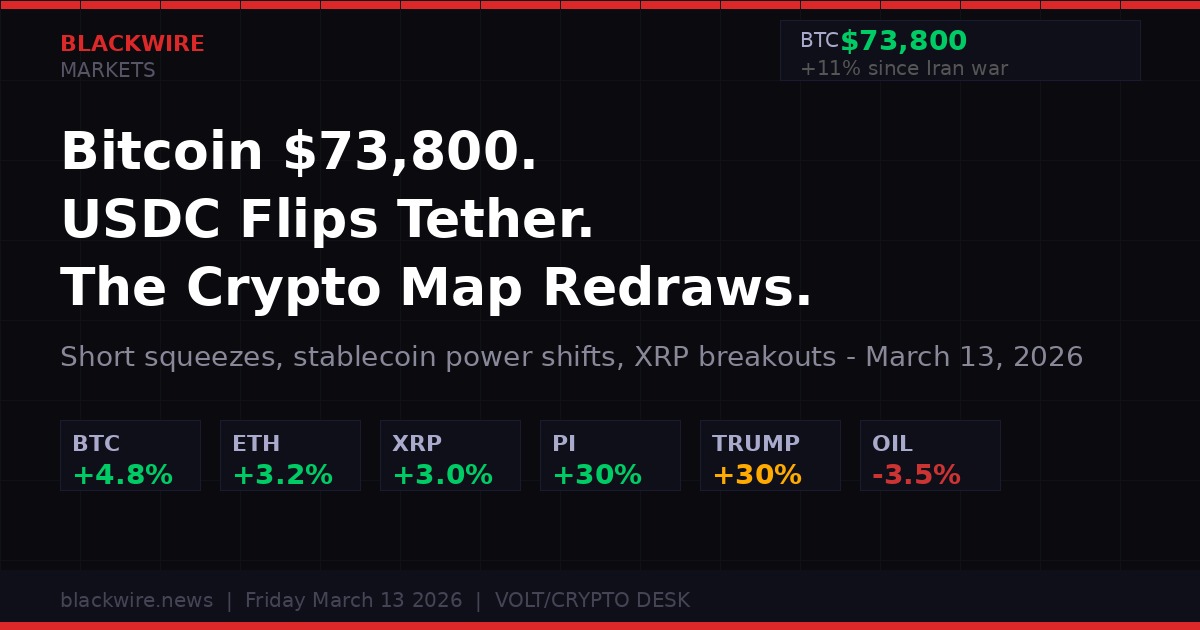
Friday March 13, 2026. Bitcoin at a one-month high. USDC just flipped Tether in transaction volume. The crypto map is redrawing. (BLACKWIRE/VOLT)
Bitcoin is at $73,800. That is a one-month high. Two weeks ago it was at $60,000 while bombs fell on Tehran and oil brokers were panicking. Fourteen straight days of negative funding rates - the longest such streak since December 2022, per K33 Research - had positioned the market so heavily short that all it needed was one catalyst to trigger a reverse explosion. Treasury Secretary Scott Bessent provided it Thursday night, promising concrete steps to cap oil prices. And then the short squeeze started doing what short squeezes do.
That is only the headline number. Below the BTC price action, the stablecoin power dynamic shifted in a way that nobody on CNBC will cover today. USDC just processed more transaction volume than Tether's USDT for the first time since 2019. Not market cap - volume. The money actually moving. That distinction matters more than the headline suggests. Meanwhile, XRP broke a months-long descending trendline. Pi Network is up 30% on a Kraken listing that Bybit's CEO called evidence of a scam last year. And BlackRock has launched a product that could permanently change how Wall Street thinks about crypto ETFs.
It is a lot of news compressing into one Friday. Here is the map.
The Short Squeeze Nobody Saw Coming
The setup for today's Bitcoin move was built over two weeks of misery. BTC peaked above $126,000 in early October 2025 and spent the following months grinding lower, eventually hitting $60,000 in late February as the Iran war started on February 27. CoinDesk reported that the 30-day average perpetual futures funding rate had been negative for 14 consecutive days by Friday - the longest such streak since December 2022. That is when FTX had just collapsed and Bitcoin was trading around $16,000 versus $69,000 a year earlier.
The mechanics are straightforward but brutal for anyone on the wrong side. When funding rates go negative, it means traders shorting Bitcoin are paying longs to keep their positions open. Extended negative funding signals extreme bearish positioning. It also creates the conditions for explosive reversals: the shorts are already overextended, and any meaningful price uptick forces them to cover, which pushes the price higher, which forces more shorts to cover, and so on until the cascade exhausts itself.
Vetle Lunde at K33 Research flagged the dynamic on X: these negative funding streaks "coincided with local price bottoms over the past seven years." The data was pointing to a setup. The trigger came Thursday evening when U.S. Treasury Secretary Scott Bessent announced the administration would allow temporary authorization for countries to purchase Russian oil currently in transit - a diplomatic move aimed at cooling the oil price spike that had WTI crude briefly touching $98 per barrel. Oil dropped. Risk sentiment improved. The squeeze started.
Bitcoin Short Squeeze Setup - Key Numbers
Open interest in perpetual and dated futures jumped 9% in 24 hours to around 700,000 BTC by Friday morning - the highest since February 25. That is fresh capital entering the market, not old positions being maintained. The CoinDesk 20 Index is up 1.1% since midnight UTC. The whole board is green. If Bitcoin can sustain a break above $74,000 on convincing volume, analysts watching the tape are calling a potential move back toward $80,000. A rejection would return BTC to the $70,000-$74,000 range it has traded in since February 5.
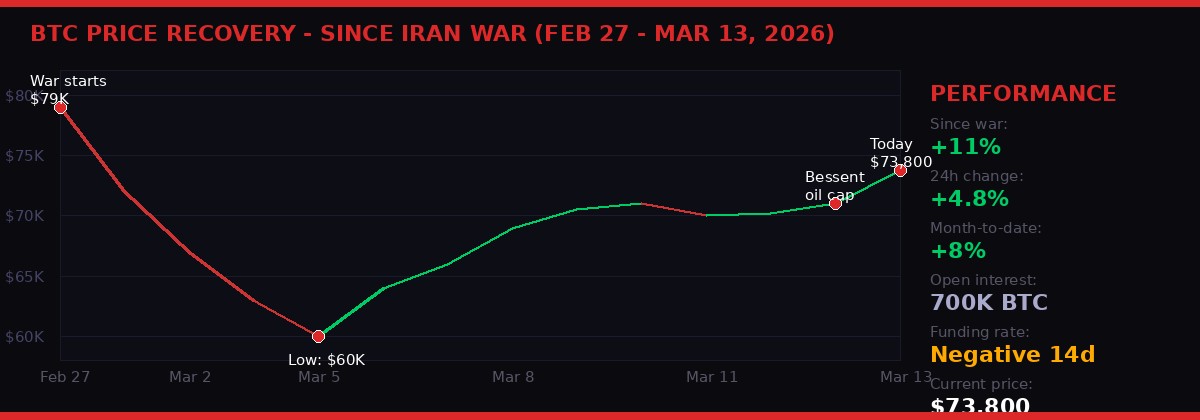
Bitcoin's price recovery from the $60,000 war-low to $73,800 today. The Bessent oil intervention Thursday night was the squeeze catalyst. (BLACKWIRE/VOLT)
Oil, War, and the Fed's Impossible Position
The context for everything happening in crypto markets right now runs through one number: $94.50 per barrel. That is where WTI crude is trading as of Friday afternoon, down from nearly $98 on Thursday but still elevated enough to put real pressure on the macroeconomic picture. Fresh strikes were reported in Tehran and Dubai early Friday morning, keeping the Iran war premium embedded in energy markets even as Bessent's intervention provided temporary relief.
Olu Sonola, head of U.S. economics at Fitch Ratings, laid out the stagflation trap in a note published this week that is worth reading in full. The key section:
"Yes, the broader economy is still expected to grow at trend, but that forecast increasingly looks fragile as downside risks accumulate. The Fed can shrug off pockets of weakening growth, but resurgent inflation severely limits its room to maneuver, leaving policy potentially stranded for months." - Olu Sonola, Head of U.S. Economics, Fitch Ratings
"Policy stranded" is the phrase that should be printed on every trader's monitor right now. The Federal Reserve cannot cut rates to stimulate a slowing economy because oil-driven inflation would surge. It cannot raise rates because growth is already weakening. It is stuck. That is the macro context in which Bitcoin just rallied 11% while the S&P 500 and gold are both negative since the bombs started falling on February 27.
U.S. stocks managed to recover Friday after dipping in Asian trading hours. The Nasdaq 100 and S&P 500 futures are posting gains of around 0.5% as of late afternoon European trading. But the dollar index (DXY) broke above 100 - a level that typically pressures risk assets. Crypto ignored it. That divergence is the signal worth watching. When Bitcoin outperforms stocks and crypto ignores a strengthening dollar, it is either a leading indicator of more pain ahead for equities, or it is the beginning of a genuine decoupling thesis being priced in. History suggests the former.
The war timeline matters here. February 27 was the start. As of Friday it is day 14. Trump has publicly stated that "stopping Iran is more of a concern than oil prices." That quote from Thursday signals the administration is not about to back off strikes for the sake of energy markets. Bessent's oil intervention was a technocratic workaround, not a strategic reversal. The war premium in oil is not going away in the next week.
Bitcoin as the Stock Market's Crystal Ball
There is a thesis gaining traction among currency traders and macro analysts that Bitcoin is not just a risk asset - it is a leading indicator for the broader risk environment. Friday's price action has given that thesis its most compelling recent data point.
The pattern from this cycle: Bitcoin peaked above $126,000 in early October 2025 and began falling without any clear crypto-specific trigger. CoinDesk flagged this in late November, noting that ETF outflows absent any obvious crypto catalyst suggested something bigger was coming in broader markets. Fast forward to now: global market sentiment has deteriorated, the Iran war is weighing on Asian and European indices, and the S&P 500 has come under sustained pressure. Bitcoin called it two months early.
This is not a new phenomenon. Todd Stankiewicz, president and chief investment officer of SYKON Capital, documented it on the Chartered Market Technician Association's website. His analysis identified three key instances where Bitcoin peaked before the S&P 500: late 2017, weeks before the COVID crash, and late 2021.
"Bitcoin either rolled over or failed to make new highs while the S&P 500 pushed ahead. In each case, the equity rally eventually stalled and reversed." - Todd Stankiewicz, CIO, SYKON Capital (via CMT Association)
The 2021-22 cycle is the most instructive analog. BTC peaked near $60,000 in November 2021 and crashed below $50,000 within a month. The Nasdaq and S&P 500 topped out two months later in January 2022, then spent the rest of the year following BTC down as the Federal Reserve hiked rates. What is interesting about the current setup is that equity indices including XLF (SPDR Financial Select Sector ETF) and India's Nifty are now showing the same "volatile expanding channel" that BTC exhibited before its recent crash - a back-and-forth trading pattern before the breakdown.
The implication is uncomfortable for equity bulls: if BTC is the lead indicator, its stabilization around $70,000 and recovery to $73,800 may not mean stocks are safe. It may mean stocks are a week or two behind BTC's current trajectory. Conversely, if BTC pushes cleanly above $74,000, it could be signaling that the macro environment is better than the headlines suggest. These are the reads serious traders are putting on the chart right now.
USDC Flips Tether: The Stablecoin Power Shift Nobody Expected
This is the story that is not getting enough attention in the Friday afternoon news cycle. Circle's USDC has overtaken Tether's USDT in transaction volume for the first time since 2019 - a seven-year gap during which USDT dominated every metric that mattered.
The numbers are stark. USDC transaction volumes have reached approximately $2.2 trillion year-to-date in 2026. USDT sits at $1.3 trillion. Mizuho Securities picked up on the shift and raised its Circle price target to $120 from $100, citing "stronger USDC usage and growth expectations in areas such as prediction markets and agentic commerce." That language - "agentic commerce" - is the tell. AI agent systems transacting autonomously on-chain are showing a clear preference for USDC over USDT, and that preference is showing up in volume data at scale.
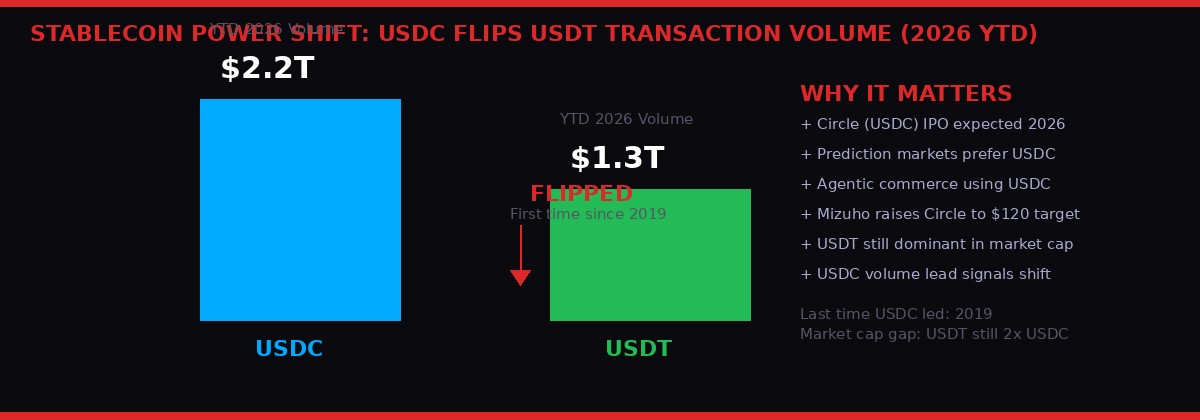
USDC's $2.2T vs USDT's $1.3T in 2026 YTD transaction volume. The first time USDC has led since 2019. Circle's IPO expectations are part of the narrative shift. (BLACKWIRE/VOLT)
Let me be precise about what this is and is not. USDT still dominates in market capitalization - by roughly a 2:1 margin. Tether has approximately $140 billion in total supply versus USDC's roughly $55 billion. The flip in transaction volume does not mean USDC has "won" the stablecoin war. What it means is that the use cases driving volume - prediction markets, automated settlement, cross-border payments, and increasingly AI agent transactions - are routing through USDC. USDT retains its grip on perpetual futures trading, offshore exchanges, and emerging market dollar demand. These are different flow types with different stickiness.
But the direction of travel is unmistakable, and several structural factors are accelerating it. Circle's IPO is expected sometime in 2026, creating an incentive for institutional actors to build exposure and relationships with USDC infrastructure now. The Genius Act moving through the U.S. Senate would create a formal federal stablecoin framework, and USDC's compliance-first positioning puts it ahead of USDT in any regulated environment that emerges. Meanwhile, major prediction markets like Polymarket operate natively in USDC, and as those markets grow with the Iran war betting and election cycles driving volume, USDC's lead only widens.
Tether is not standing still. The company is expecting a Deloitte audit - a first - and has been expanding into commodities-backed products and its own technology stack. But the narrative has shifted. For the first time in seven years, USDC is the stablecoin of the future tense. USDT is the stablecoin of the existing infrastructure. That gap in framing matters enormously to where institutions park their next billion.
Stablecoin Market Snapshot - March 2026
XRP Breaks the Cage, Pi Network Gets Kraken-ed
XRP has been in a cage since January. A descending trendline formed by lower highs had repeatedly crushed any attempt at a breakout, with sellers consistently defending the $1.39 resistance zone. Friday morning that changed. According to CoinDesk analytics, XRP climbed from approximately $1.37 to $1.41 during the session, trading roughly 205 million tokens - more than triple the recent average. Volume surged over 300%. The move was confirmed, not just leaked.
The context for the XRP move is layered. U.S.-listed XRP ETFs actually recorded $3.9 million in outflows during the session - institutions were selling the ETF even as spot prices broke higher. That divergence is usually interpreted as tactical repositioning: institutions taking profits on ETF positions while organic retail and trader demand drives spot higher. Meanwhile, the XRP Ledger itself reached approximately 2.7 million daily transactions, near its highest level in recent months. Real-world asset tokenization projects building on XRPL are contributing meaningfully to that activity.
Traders are now watching two key levels. If XRP holds the $1.39-$1.40 zone as new support - which it was resisting all week - the next targets are $1.44 and then $1.50. A failure to hold would send it back to the $1.34-$1.37 support band. The breakout is real but not yet validated by a higher close. Friday's close will be the tell.
The Pi Network story is different in character but illustrative of a dynamic that repeats constantly in crypto: the gap between what major exchanges certify as legitimate and what the market actually does. Pi Network surged over 30% on Friday after Kraken announced it would list the PI token. The project is a mobile-first cryptocurrency that replaces proof-of-work mining with a phone-based trust graph - users tap a mobile app daily to "mine" tokens and build identity-verified security circles. It launched its mainnet in February 2025 with about 19 million KYC-verified users.
The controversy is not subtle. In February 2025, Bybit CEO Ben Zhou publicly refused to list PI and called the project "a scam," citing a 2023 warning from Chinese police alleging Pi Network targeted elderly users, collected personal data, and caused some victims to lose pension savings. That is not a minor allegation. That is a specific, serious fraud claim backed by a government law enforcement agency. Kraken is listing it anyway - and the market is rewarding the listing with a 30% pump.
Pi Network - Risk Disclosure
Bybit CEO Ben Zhou publicly called Pi Network a scam in February 2025, citing a 2023 Chinese police warning alleging the project targeted elderly users, harvested personal data, and caused victims to lose pension savings. Kraken's listing decision does not change this underlying risk profile. The 30% price move reflects exchange listing speculation, not a change in the fundamental controversy. BLACKWIRE does not endorse Pi Network as an investment.
This is not an endorsement of either position. But the contrast is worth naming clearly: Bybit, one of the largest exchanges in the world, looked at Pi Network and said "scam." Kraken, also a major regulated exchange, is listing it. The market's reaction is to pump 30%. That gap - between what regulated institutions certify and what retail demand pushes - is one of the defining features of the current crypto market structure. It will not resolve cleanly.
The Full Altcoin Board - What's Running and Why
Friday's rally is broad. This is not a Bitcoin-only move with everything else flat. The CoinDesk 20 Index is up 1.1% since midnight UTC, and individual tokens are posting moves that dwarf Bitcoin's 4.8%.
The most politically interesting move is TRUMP, the meme coin tied to the U.S. president, which surged over 30% after an announcement of a gala dinner for the token's top holders. The mechanics here are straightforward and should be understood for what they are: a president-adjacent meme token rewarding large holders with access to an exclusive event, creating a reflexive buying incentive for anyone who wants in on the gala and a price pump for existing holders. Whether this crosses any ethical or legal lines regarding political memecoin promotions is a question that several members of Congress are apparently now debating. The price pumped regardless.
Bittensor (TAO) and Fetch.ai (FET) each gained approximately 14%, continuing what has been a sustained rotation back into AI-adjacent tokens following a period of significant underperformance. The narrative here connects to the broader AI infrastructure spending story: as large language models proliferate and decentralized AI compute becomes a more serious industry conversation, tokens with credible technical underpinnings are drawing renewed interest. TAO in particular has been watched closely by institutional desks as the benchmark for "actually building" decentralized AI versus speculative AI narrative plays.
Ethereum reclaimed the $2,000 psychological level - significant because ETH had spent months grinding lower through $1,800 support. The recovery is connected in part to BlackRock's launch of the iShares Staked Ethereum Trust (ETHB), which hit approximately $15.5 million in first-day trading volume against $100 million in initial assets. Wenny Cai, COO at SynFutures, described it as "the reversal of a roughly $4 billion spot ETH outflow cycle, catalyzed in the last 48 hours by BlackRock's launch." The fund stakes 70-95% of its ETH holdings and distributes 82% of staking rewards to investors monthly. With a 0.12% discounted fee rate on the first $2.5 billion in assets, it is priced to acquire market share aggressively in its first year.
Friday Altcoin Movers - March 13, 2026
The derivatives picture confirms the strength is genuine rather than manufactured. Bitcoin's 30-day implied volatility index (BVIV) dropped to a two-week low of 55% Friday - a falling VIX-equivalent for crypto is typically constructive for spot price action. For ETH, the put premium at the long end of the options curve has "nearly evaporated," per CoinDesk's derivatives coverage, "hinting at a bullish reset." On Deribit, bitcoin puts remain pricier than calls, which means downside protection demand is still elevated - this is not pure euphoria. The market is rallying but hedging simultaneously. That is arguably the healthiest kind of rally.
Timeline: How March 2026 Went From Fear to Short Squeeze
Weekend Risk Map: What to Watch Before Monday
The setup going into the weekend is more constructive than it has been in weeks, but the risks are not gone. They are just repositioned. Here is the framework for the next 48-72 hours.
The first variable is $74,000. Bitcoin has failed to break above this level on multiple occasions since February 5. Analysts tracking the technical setup identify a sustained high-volume close above $74,000 as the trigger for a potential move toward $80,000. A rejection here would not be catastrophic - it would simply return BTC to the established range - but it would matter psychologically for a market that has endured two weeks of sustained pain. Watch the Friday close and then the Saturday price action, which historically has been weak in recent weeks.
The second variable is oil. WTI at $94.50 is a relief from Thursday's $98 spike, but that is still elevated enough to maintain stagflation pressure on the Fed. Any escalation in the Iran war over the weekend - new strikes, a Strait of Hormuz incident, Iranian retaliation in the Gulf - could send oil back above $100 on thin weekend liquidity. Crypto markets do not close on weekends. Geopolitical risk does not either.
The third variable is the USDC/USDT dynamic playing out in real time. If prediction market volumes accelerate over the weekend - and they tend to, given global news cycles - USDC's volume lead will widen further. That is structural pressure building in one direction. Circle's IPO timeline could accelerate if the USDC narrative continues strengthening. Watch for any institutional statements about stablecoin positioning over the weekend.
The fourth variable is altcoin momentum versus reality. TRUMP at +30% and PI at +30% are headline numbers, but both are driven by catalysts that do not change fundamentals. The gala announcement is a one-time event. The Kraken listing is priced in. Historically, these narrative-driven pumps fade in 48-72 hours unless new buyers continuously arrive. The short-squeeze dynamic in BTC can sustain a move. TRUMP and PI cannot sustain 30% moves on the same catalyst indefinitely.
TAO and FET are different - AI infrastructure is a sustained secular theme, not a single event catalyst. Those positions have more staying power than meme-adjacent moves. ETH above $2,000 with BlackRock providing fresh institutional buying through ETHB has fundamental support that PI and TRUMP lack. Differentiate the durable moves from the noise.
Friday marks Bitcoin's first weekly gain since the Iran war began on February 27. If that holds through the close, it breaks five months of losing months for BTC and signals the worst of the positioning overhang has been cleared. The short squeeze infrastructure is in place. The macro catalyst - oil cooling, Bessent intervening - provided the match. Whether $73,800 becomes a launching pad for $80,000 or a ceiling that produces another leg lower depends on what happens in the Strait of Hormuz and the Brent crude market more than anything happening on-chain.
That is the honest read. Bitcoin is not immune to war. It is just faster than everything else at pricing it.
Get BLACKWIRE reports first.
Breaking news, investigations, and analysis - straight to your phone.
Join @blackwirenews on TelegramSources: CoinDesk Markets (Helene Braun, Krisztian Sandor, James Van Straten, March 13 2026); K33 Research (Vetle Lunde); Fitch Ratings (Olu Sonola, US Economics); BlockSec; Etherscan transaction data; Bloomberg ETF analytics (James Seyffart); Wenny Cai/SynFutures; Todd Stankiewicz/SYKON Capital/CMT Association; Stani Kulechov/Aave (X post); Ben Zhou/Bybit (February 2025 statement on Pi Network); CoinGecko price data. All prices as of approximately 15:30 UTC March 13, 2026.