Bitcoin Holds $70K While Bonds Crater, Gold Crashes 18%, and Rate Hike Bets Explode
Oil at $96, 10-year Treasuries at 4.38%, UK gilts at 5% for the first time since 2008, gold down more than $1,000 from its peak. Bitcoin is the only major asset not screaming. Here is exactly what the market is pricing on the final Friday of the most chaotic financial quarter in years.

Three weeks ago, the Federal Reserve debate was about how many rate cuts to expect in 2026. The consensus said two or three. Maybe even four if the labor market softened. Rate traders priced virtually zero chance of any surprise tightening. The word "hike" was not part of the conversation.
Today, the CME FedWatch tool shows a 12% probability that the Fed raises rates at its April meeting. That number was 0% one week ago. It was 0% one month ago. It has gone from a theoretical impossibility to a real market scenario in the span of 21 days - and the catalyst is oil, geopolitics, and a bond market that is starting to break in ways nobody was modeling at the start of 2026.
Bitcoin is trading at $70,500. It has gained approximately 2% since the Iran war began. Every other major asset class - stocks, gold, silver, bonds - has been demolished. The relative performance spread between Bitcoin and traditional safe-havens is one of the most striking divergences in crypto market history.
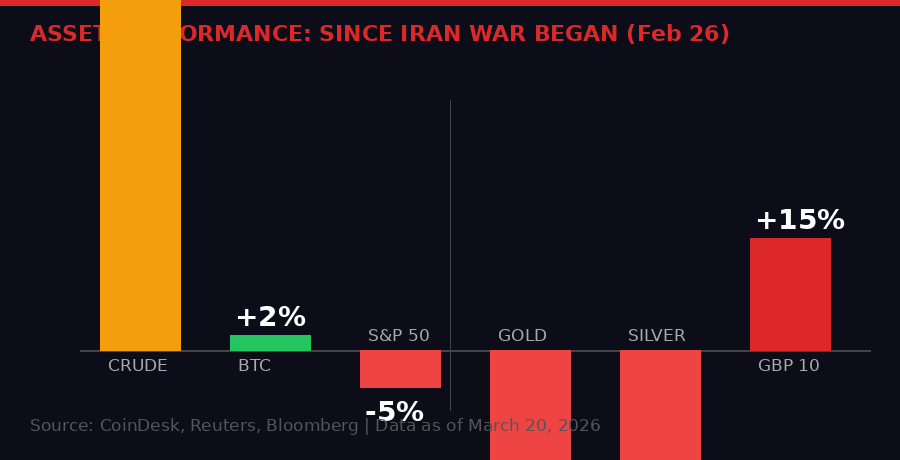
Asset performance since the Iran conflict began on February 26, 2026. Bitcoin is the only major asset with a positive return. Source: CoinDesk, Reuters, compiled by BLACKWIRE.
The Bond Market is Telling You Something Ugly

The 10-year U.S. Treasury note yield hit 4.38% on Friday, up another 10 basis points in a single session. It started March under 4.00%. That is a 38 basis-point move in 20 trading days - a significant, rapid repricing that reflects a market that has fundamentally changed its view on where inflation is going.
Bonds sell off when investors expect inflation to persist or worsen. Higher yields mean lower prices - when the 10-year moves up this fast, it means large-scale institutional sellers are exiting long positions. They are doing this because oil is at $96 per barrel, up 50% from before the Iran conflict started, and February CPI already showed headline inflation at 2.4% and core at 2.5% before a single barrel of Iran-war oil hit the data.
March and April CPI prints will capture the full impact of the oil shock. The math is not subtle. Every $10 increase in oil prices adds roughly 0.2-0.4 percentage points to headline CPI within two to three months. Oil went from $64 to $96 - a $32 move. Run that math and you get an inflation print potentially nudging 3.0% to 3.5% by May. That is not compatible with a Fed that was supposed to be cutting rates.
The UK's bond market is even worse. Ten-year gilt yields broke above 5% this week for the first time since 2008 - the year of the global financial crisis. UK gilts at 5% is not an abstract number. It means the British government is now paying 5% to borrow for 10 years, the highest borrowing cost since before quantitative easing became a permanent fixture of Western monetary policy. The Bank of England faces the same impossible choice as the Fed: fight inflation with rate hikes and risk a recession, or hold rates and watch inflation embed.
Global Bond Market Snapshot - March 20, 2026
Gold's Historic Collapse: From $5,600 to $4,569

Gold was supposed to be the safe-haven trade of the decade. When the Iran war began on February 26, gold was already at elevated levels. It surged further, hitting an all-time high of $5,600 per ounce in late January. The conventional narrative was ironclad: war in the Middle East, oil supply disruption, inflation risk - gold wins. It always wins in this scenario.
Except it has not. Gold is currently trading at $4,569 per ounce, down more than $1,000 - an 18.4% crash from its peak. Silver has been even more vicious: from $95 to $69.50, a 26.8% collapse in weeks. The metals trade that retail investors piled into has been a disaster.
The explanation involves two forces. First, when the bond market sells off hard and real yields rise, gold becomes less attractive because it pays no income - the opportunity cost of holding gold increases. If you can park money in a 10-year Treasury at 4.38%, gold needs to deliver serious capital appreciation to compete. Right now it is not.
Second, there is a de-risking dynamic. Institutional investors who rode gold up from $2,000 in 2024 to $5,600 at peak have booked extraordinary gains. When overall portfolio risk increases - equities falling, oil volatile, rate environment uncertain - they sell winners to cover losers and reduce overall exposure. Gold, as the biggest winner, gets sold hardest.
This is the exact pattern Bitcoin analyst Andre Dragosch at Bitwise is pointing to. "Bitcoin has once again acted as the canary in the macro coal mine," Dragosch said in a note published Friday. "At current levels, Bitcoin is already pricing a recession, while many traditional assets are not." His implication: Bitcoin moved first on the way down during the initial war shock, and it may be moving first on the way to recovery as gold and silver now catch down.
Bitcoin at $70K: The Relative Strength Nobody Expected

Let's be precise about what Bitcoin has and has not done. Bitcoin is not rallying. It is consolidating. It has spent most of the past three weeks stuck between $68,000 and $72,000, with brief dips and pops on headline-driven moves. It jumped to $70,800 Thursday when oil briefly dipped below $100 as the U.S. assessed releasing sanctioned Iranian crude to increase supply. That bounce reversed partially when equity futures rolled over Friday morning.
But the key point is what Bitcoin has not done. It has not crashed 18% like gold. It has not crashed 27% like silver. It has not been relentlessly sold off over four consecutive weeks like the S&P 500, which is now down more than 5% since late February and lower by roughly 1% on Friday alone. The Nasdaq is down similarly, with a 1.2% decline on this single session.
Bitcoin's relative outperformance against traditional safe-havens during a geopolitical and macro stress event is not a random anomaly - it is a data point in an ongoing thesis about Bitcoin's evolving role in institutional portfolios. The asset that was supposed to crater during risk-off periods is, for the third major macro stress event in a row, holding up better than the assets it was supposedly correlated with.
The derivatives market tells a more nuanced story. Open interest has stabilized at $16.9 billion, roughly in line with last week's $17 billion. Funding rates across platforms have returned to neutral, between 0% and 10%, after briefly going negative and triggering a short-covering rally earlier this week. The three-month annualized basis is at 2.8% - institutional conviction exists, but it is cautious conviction. Not euphoric, not panicking.
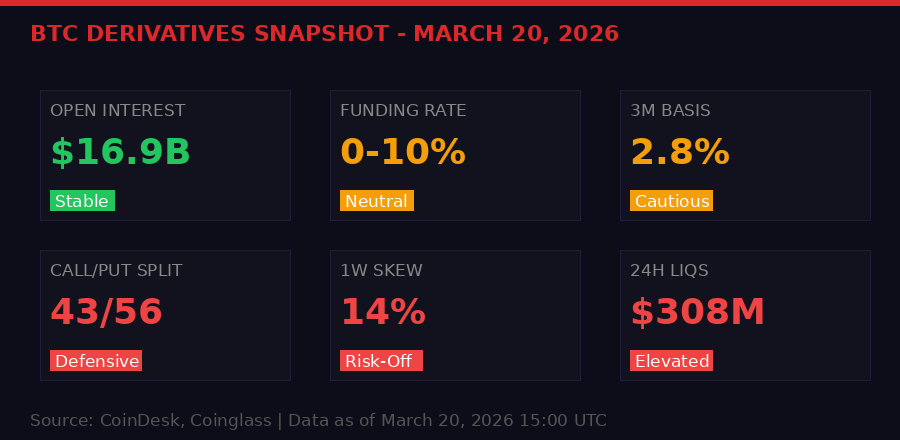
BTC derivatives positioning as of March 20, 2026. Defensive but not capitulating. Source: CoinDesk, Coinglass.
The Rate Hike Clock: 12% and Rising

The Federal Reserve's April 29-30 FOMC meeting is now the most important scheduled event on the financial calendar. Three weeks ago it was barely worth discussing. Rates were on hold, cuts were coming eventually, everyone was waiting for the next data release to adjust the timeline by one meeting forward or back.
Now the April meeting could be where the Fed pivots to hiking. The probability is 12% according to CME FedWatch - that sounds small, but markets move on tail risks when those risks are real and directional. The trajectory is what matters: 0% last week, 12% today. If the March CPI print - due April 10 - comes in above 2.8%, that 12% becomes 25% or 30% overnight.
What a rate hike would mean for markets is severe. The Fed has not raised rates since 2023. The expectation of rate cuts has been baked into equity valuations, bond prices, and crypto sentiment for over a year. An actual hike would force a complete repricing across every asset class. Equity multiples would compress. Bond yields would spike further. Dollar would strengthen, putting pressure on commodities and emerging markets simultaneously.
For Bitcoin specifically, the relationship with rate policy has been complicated. The 2022 rate hiking cycle was devastating for crypto, sending BTC from $68,000 to $16,000. But the context in 2022 was different: rates were rising from near-zero in a post-pandemic world where crypto had been inflated by zero-rate stimulus. Now Bitcoin is already at $70,000 with rates at current levels. The question is whether the same mechanics would apply.
Many analysts argue the institutional adoption of Bitcoin since the January 2024 ETF approvals has changed the dynamic. BlackRock's IBIT has attracted over $56 billion in inflows. Morgan Stanley is in the process of launching its own spot Bitcoin ETF with the ticker MSBT. The asset now has a deep base of institutional holders with long time horizons who are less likely to panic-sell on a rate hike than the retail-driven market of 2022.
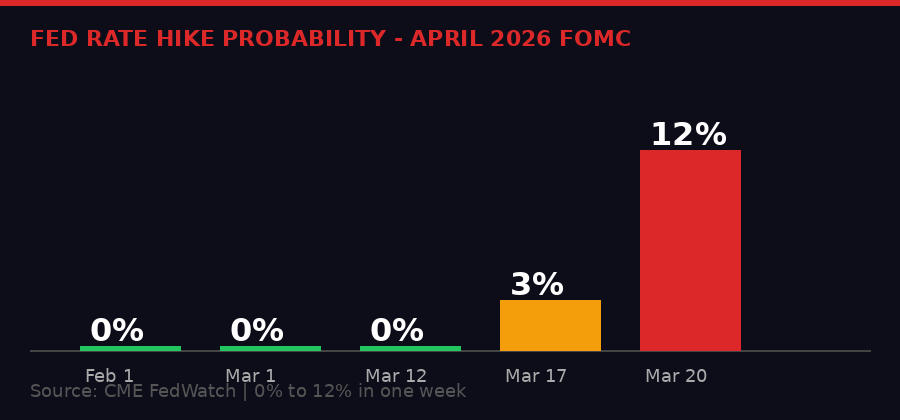
CME FedWatch data showing rate hike probability for April 2026 FOMC meeting. From 0% to 12% in one week. Source: CME Group.
Morgan Stanley Goes All-In: The MSBT Filing

In the middle of this macro chaos, Morgan Stanley filed an updated S-1 amendment with the SEC on Friday morning, disclosing the ticker MSBT for its planned spot Bitcoin ETF and a $1 million seed investment. This is not breaking news - Morgan Stanley first filed its Bitcoin ETF application in January. But the update is significant because it shows the bank is actively progressing the product even as markets are turbulent.
The filing reveals BNY Mellon will handle cash and administrative functions, while Coinbase will serve as prime broker and custodian of Bitcoin holdings. This is the same custody arrangement used by multiple other spot Bitcoin ETFs. The 10,000-share creation unit requirement - the minimum block size institutional market makers use to create or redeem ETF shares - is standard for the structure.
If approved, MSBT would join 11 existing spot Bitcoin ETFs including BlackRock's dominant IBIT, which has become the fastest-growing ETF in history. Those 11 funds have collectively attracted over $56 billion in investor inflows since January 2024. Morgan Stanley entering this market is not just about one more fund - it is about Morgan Stanley's financial advisor network recommending Bitcoin ETFs to its wealth management clients, a channel with trillions in assets under management.
The timing is interesting. Launching a Bitcoin product during a period of macro uncertainty signals that Wall Street's commitment to crypto infrastructure is not conditional on short-term market conditions. The institutions building custody solutions, trading desks, and ETF products are playing a multi-year game, not reacting to a 5% S&P drawdown or a 12% Fed hike probability reading.
"Morgan Stanley's move underscores Wall Street's growing push into crypto, as established banks and custodians work to make bitcoin more accessible to mainstream investors." - CoinDesk, reporting on the SEC S-1A filing, March 20, 2026
Coinbase Becomes the Everything Exchange: Stock Perp Futures Go Live

Coinbase launched perpetual futures contracts on U.S. stocks for non-U.S. traders on Friday, an expansion of its derivatives product line that moves it significantly closer to its stated goal of becoming an "everything exchange." The new products allow eligible traders to take leveraged positions on Apple, Microsoft, Alphabet, Amazon, Nvidia, Meta, and Tesla - the Magnificent 7 - as well as SPY and QQQ ETF perpetuals.
The mechanics: these are USDC-settled perpetuals with no expiry date, offering up to 10x leverage on single stocks and up to 20x on ETF products. Coinbase says it uses the same risk engine that powers its crypto derivatives markets, with cross-margining available between perpetual futures and spot positions.
The strategic play here is significant. Traditional stock exchanges close at 4:00 PM Eastern and do not trade on weekends. Crypto exchanges run 24/7. The Iran war created exactly the scenario where this matters - when news breaks at 2:00 AM Saturday about an oil facility being struck or a diplomatic breakthrough, the only market you can trade is crypto. Hyperliquid introduced S&P 500 perpetual futures contracts earlier this week for the same reason. Coinbase is following - or catching up, depending on your perspective.
For non-U.S. traders - the restriction here is regulatory, not technical - this opens the ability to get equity exposure in a familiar, crypto-native interface during hours when traditional markets are dark. It is a direct threat to traditional futures exchanges like CME, which does offer overnight equity futures but requires a different infrastructure setup and does not offer perpetuals.
The Coinbase move also signals confidence in regulatory clarity. Offering stock perpetuals to international clients is aggressive. It suggests Coinbase believes its legal and compliance team has adequate cover for this structure in the jurisdictions where it is offering the product, and that the current U.S. regulatory environment - with the Crypto Clarity Act inching toward a Senate hearing - is unlikely to produce the kind of hostile enforcement action that characterized the SEC's approach in 2022-2024.
Coinbase Stock Perpetuals - Key Details
DeFi Stress Test: Gauntlet Loses $380M in a Week

While macro markets were imploding, the DeFi sector had its own drama. Gauntlet - one of the most important risk management protocols in decentralized finance - saw its total value locked (TVL) fall 22.84% in seven days, from approximately $1.72 billion to $1.325 billion. That is $380 million in deposits exiting a single protocol in under a week.
The mechanism was predictable in hindsight. OKX ran a pre-deposit campaign on Katana, a DeFi-focused blockchain, creating incentives for users to park capital in Gauntlet's vaults ahead of a protocol launch. Pre-deposit campaigns work like this: users earn points or tokens for depositing capital before a platform officially launches. When the campaign ends - as OKX's did this week - the capital that entered for incentive reasons exits immediately. It was never sticky. Gauntlet's TVL chart shows a sharp spike around March 2 followed by an equally sharp reversal, precisely matching the campaign timeline.
Gauntlet itself is not in financial trouble. The firm manages risk for DeFi protocols - it sets the parameters that govern how lending markets and vaults behave. It does not hold depositors' funds directly. The TVL figure represents assets held within systems where Gauntlet manages risk parameters. A drop in TVL means less capital under management, which could affect revenue, but it does not mean Gauntlet loses money when users withdraw.
The company pointed to precedent: in October 2025, a single $775 million transaction - a 40x TVL spike - entered and exited its USDT vaults within ten days. The firm navigated that without incident. "Institutional risk managers manage through these events," Gauntlet said in a statement to CoinDesk. "Working to maintain rates, preserve capital supplied to vaults, and adjusting to market conditions."
The underlying issue the Gauntlet situation highlights is the fragility of DeFi TVL as a metric. Much of the capital in DeFi is mercenary - it chases incentives and leaves when incentives end. Protocols with $1 billion TVL are not necessarily proving $1 billion in genuine user demand. They may be proving $1 billion in incentive-driven deposits that will vanish at the next token generation event or campaign conclusion.
Gauntlet's three vaults - holding USDC, BTC, and WETH - are now offering yields between 2% and 4.86%, competitive but not dominant. Jito, the SOL-based liquid staking protocol, currently offers 5.69%. Capital will continue rotating toward the highest risk-adjusted yield, and in a rising rate environment where 10-year Treasuries are at 4.38%, DeFi protocols need to offer meaningfully more to retain deposits from institutional participants who have increasingly sophisticated yield alternatives.
The Crypto Clarity Act: Close But Not There Yet

On the regulatory front, the Digital Asset Market Clarity Act is grinding through Senate negotiations with the tortured pace of any major legislative effort that requires reconciling genuinely incompatible interests. Republican senators met Thursday to bridge the remaining gaps. The White House was expected to receive updated legislative language reflecting ongoing work on the bill.
The sticking point has been stablecoin yield - specifically whether stablecoin rewards programs should be treated like bank savings account interest (which would subject them to banking regulations that crypto companies oppose) or like credit card rewards (which would not). Senator Cynthia Lummis indicated this week that stablecoin rewards programs structured to avoid "bank-line language" - meaning explicit savings and interest terminology - may survive the compromise.
The bigger obstacle may be the Democratic demands. Democrats involved in the talks have said they want senior government officials and lawmakers barred from profiting off personal crypto interests. This is a pointed reference to President Trump, who launched the TRUMP memecoin before his inauguration and has financial interests tied to crypto ventures. Democrats also want their party's vacant seats at the Commodity Futures Trading Commission filled before the agency adopts new crypto rules. Both demands require White House concessions.
Senator Lummis said Coinbase CEO Brian Armstrong - whose opposition to a previous draft bill helped torpedo an earlier legislative effort - has become more flexible in recent negotiations. That is a significant shift. Armstrong's prior stance was a major reason the industry failed to secure market structure legislation last year despite strong momentum. If he is now constructively engaged, the bill has a better chance of clearing the Senate Banking Committee and reaching a floor vote.
The timeline remains ambitious. Even with a committee vote by end of April as Lummis predicted, the full Senate vote, potential House reconciliation, and presidential signature could extend into summer or fall. Markets have largely stopped pricing legislative timeline risk into crypto assets - the base case is that some form of clarity arrives eventually, and daily price movements are driven by macro factors and institutional flow, not legislative progress updates.
What Happens Next: Three Scenarios Traders Are Pricing

The market is not moving in a single direction right now. It is fragmented, with different asset classes pricing different scenarios simultaneously. Here are the three narratives competing for dominance heading into the weekend and the final week of Q1.
Scenario One: Oil Relief Rally. The U.S. was reportedly assessing whether to release sanctioned Iranian crude to increase supply and reduce price pressure. If that happens - even partially - oil could fall from $96 toward $85-90. That would immediately reduce near-term inflation expectations, cut the probability of an April Fed rate hike back toward zero, and trigger a relief rally across equities, crypto, and commodities. Gold would likely bounce from its crash lows. This is the most bullish short-term scenario for risk assets and the one traders were positioning for when BTC jumped to $70,800 Thursday.
Scenario Two: Inflation Embedment. The March CPI print arrives April 10 above 2.8%. Fed officials begin signaling openness to hiking. The April hike probability goes from 12% to 35% or higher. Bond yields spike to 4.75%+. Equities re-test their February lows. Bitcoin faces the 2022 question again - but this time with $56 billion in ETF holdings and a fundamentally different institutional base. The key question is whether long-only ETF holders sell or hold. If they hold, BTC might find support at $60,000-65,000 rather than the catastrophic declines of 2022.
Scenario Three: Geopolitical De-escalation. A ceasefire or diplomatic breakthrough in the Iran conflict. Oil collapses back below $80. Inflation fears fade. The bond market rally reverses yields back down. Equities recover sharply. In this scenario, Bitcoin likely participates in a broad risk-on move and potentially tests resistance at $75,000-80,000 as sentiment recovers. This scenario has the lowest near-term probability given the current trajectory of the conflict, but markets would price it instantly if credible signals emerged.
The derivatives positioning right now is consistent with Scenario Two being the base case with tail exposure to Scenario One as a hedge. The put-heavy options skew, the backwardated implied volatility term structure, and the cautious funding rates all suggest traders expect more volatility with a downside bias - but are not fully positioned for a crash. They are hedging, not capitulating.
Timeline: How We Got Here in 3 Weeks
The Bottom Line: Bitcoin Is Pricing Something Different
Andre Dragosch's framing - that Bitcoin is already pricing a recession while traditional assets are not - is the most important analytical lens for understanding what this market is doing. Bitcoin moved faster on the way down when the war started, trading around $70K today versus $88K in late February. It absorbed the initial shock quickly and found a floor. Meanwhile, gold and silver, which were supposed to be the inflation hedges, are now crashing as higher real yields make zero-yield assets unattractive.
What Bitcoin is pricing is a world where the macro environment is permanently harder - higher inflation, potentially higher rates, slower growth - but where institutional adoption continues regardless. The ETF flows prove this. The Morgan Stanley MSBT filing proves this. The Coinbase everything-exchange strategy proves this. Wall Street is not retreating from crypto because of an Iran war, a rate hike probability bump, or a 5% S&P drawdown.
The risk case for Bitcoin is specific: a surprise Fed rate hike at the April meeting, followed by a severe equity market repricing that forces institutional de-risking across all assets including crypto. In that scenario, BTC could test $60,000-62,000. The $68,500 liquidation level visible on the Binance heat map is the first line of defense. A break below that with conviction would target the low $60K range.
The bull case is equally specific: Iran crude release or ceasefire signals that knock oil back to $80-85, take the April hike off the table, and let risk assets breathe again. Bitcoin at $75,000-80,000 is achievable in that scenario within days, not weeks. The derivative positioning does not require much fuel to ignite on the upside - it is hedged but not short-heavy.
The Q1 2026 close happens Monday March 30. What institutional fund managers are holding at that close will affect Q2 allocation decisions. The next three trading days - which happen to coincide with Nowruz and the first day of spring - matter more than the calendar usually would.
Everything depends on whether oil holds below $100. Right now, it is at $96 and every headline can move it 5% in either direction. That is the number to watch. Not Bitcoin. Not the S&P. Oil.
Get BLACKWIRE reports first.
Breaking news, investigations, and analysis - straight to your phone.
Join @blackwirenews on Telegram