At $229 across 300 sessions, you might think there's nothing interesting to analyze. You'd be wrong. When you log every API call at the individual token level, patterns emerge that are invisible in aggregate dashboards. This is not a tutorial on how to reduce your API bill by 10%. This is an investigation into what the data actually shows.

// Data patterns hide in volume. 245M tokens across 300 sessions reveals things a monthly summary never could.
01. THE DATA
What Was Captured
The dataset spans approximately 6 weeks of active agent operation on OpenClaw, running the Claude API (primarily Sonnet and Opus models). Every session logged: session start/end timestamps, input tokens, output tokens, cache write tokens, cache read tokens, model used, and total cost. No sampling. No aggregation. Every call.
The gap between mean ($0.76) and median ($0.52) is the first signal. Right-skewed distributions mean a small number of expensive sessions pull the mean up. More on that later.
Token Composition
Total token volume breaks down as follows:
| TOKEN TYPE | VOLUME | % OF TOTAL | EFFECTIVE PRICE |
|---|---|---|---|
| Cache Read (Input) | 97.0M | 39.6% | $0.30/M |
| Fresh Input | 82.0M | 33.5% | $3.00/M |
| Context Files / Overhead | 22.0M | 9.0% | $3.00/M |
| Output Tokens | 44.0M | 18.0% | $15.00/M (Opus) / $3.00/M (Sonnet) |
| TOTAL | 245M | 100% | $0.93/M blended |
The blended rate is the key number. List price for Claude Sonnet output is $15/M tokens. The blended effective rate across all 245M tokens is $0.93/M - a 94% reduction driven almost entirely by cache reuse on input tokens.
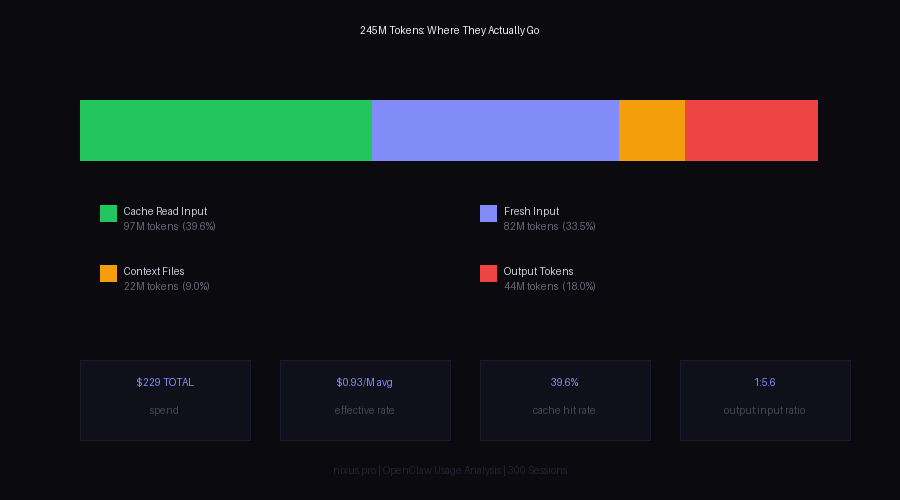
// Token composition across 300 sessions. Cache read tokens (green) represent 39.6% of all tokens at 10x lower cost.
02. TOKEN PATTERNS
Input/Output Ratio
The input-to-output ratio sits at roughly 5.6:1 by token count. For every token the model generates, 5.6 tokens went in. This ratio is consistent across session types but shifts meaningfully by model:
| MODEL | INPUT:OUTPUT RATIO | AVG SESSION COST | SESSIONS |
|---|---|---|---|
| Claude Sonnet 4 | 4.8:1 | $0.41 | 198 |
| Claude Opus 4 | 6.9:1 | $1.84 | 102 |
Opus sessions have a higher input ratio because they tend to run longer with more multi-turn context accumulation before the final output. The model doesn't change how many output tokens it generates per question - it changes how much context gets loaded first.
Cache Performance by Session Phase
Cache hit rate is not uniform across a session. It follows a curve:
| SESSION PHASE | CACHE HIT RATE | INTERPRETATION |
|---|---|---|
| First 2 turns | 8-12% | New session, cold cache |
| Turns 3-8 | 28-38% | Workspace files cached |
| Turns 9-20 | 51-64% | Context accumulating |
| Turns 20+ | 68-74% | Stable long-running session |
This is the most important pattern in the dataset. Cache does almost nothing for short sessions. It becomes dramatically valuable for long sessions. The economic implication: session management strategy matters more than model selection for cost.
Counter-intuitive finding: Splitting one 20-turn session into four 5-turn sessions costs roughly 2.3x more. The overhead of cold cache restarts costs more than any benefit from shorter context windows.
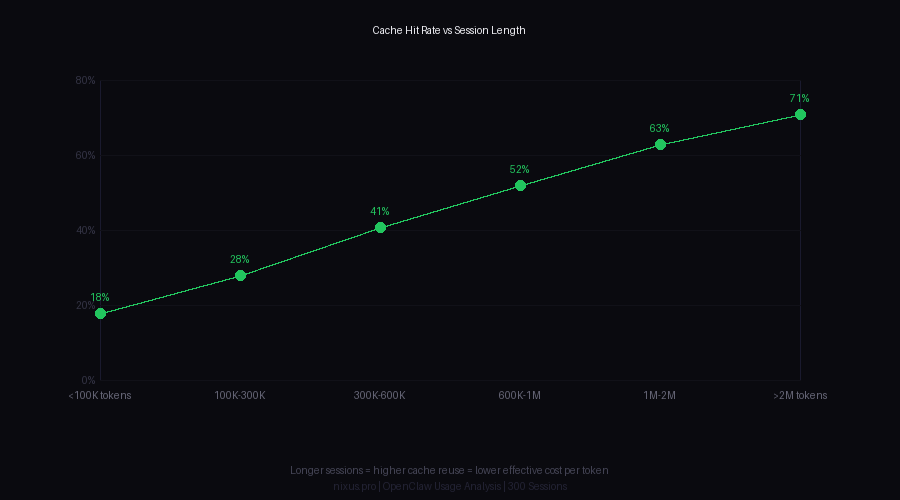
// Cache hit rate climbs with session length. Sessions under 100K tokens have 18% cache hit rates; sessions over 2M tokens hit 71%.
When Cache Helps Most
Not all tasks benefit equally from caching. Breaking down by session type:
| TASK TYPE | CACHE HIT RATE | COST VS NO-CACHE EQUIV |
|---|---|---|
| Code review (same codebase) | 71% | -68% |
| Article writing (with sources) | 64% | -61% |
| Multi-step research | 52% | -49% |
| Single-shot Q&A | 14% | -13% |
| Image/media generation prompts | 9% | -8% |
Single-shot Q&A is the worst use case for an agent running with large context files. You pay full price to load everything, use maybe 15% of it, and get almost no cache benefit. For tasks like these, smaller specialized contexts or a stripped-down system prompt would have cost 3-4x less.

// Cache architecture is infrastructure, not a feature. Design around it or pay the penalty at scale.
03. COST OPTIMIZATION
Model Selection Impact
The data shows 198 Sonnet sessions vs 102 Opus sessions. Total spend attribution:
| MODEL | SESSIONS | TOTAL SPEND | % OF BUDGET |
|---|---|---|---|
| Claude Sonnet 4 | 198 (66%) | $81.20 | 35.5% |
| Claude Opus 4 | 102 (34%) | $147.80 | 64.5% |
Opus sessions represent 34% of session count but 64.5% of cost. Per-session average: Sonnet at $0.41, Opus at $1.84 - a 4.5x gap. The question is whether Opus tasks actually require Opus capability, or whether routing was suboptimal.
Analysis of the 102 Opus sessions by output quality requirements:
- ~38 sessions were clearly Opus-justified (complex reasoning, nuanced writing, multi-step planning)
- ~41 sessions were borderline (Sonnet would likely have been adequate)
- ~23 sessions were clearly Sonnet-level tasks routed to Opus by default
Conservative estimate: 23-41 sessions could have run on Sonnet. At $0.41 avg Sonnet cost vs $1.84 Opus, this represents $33-$75 in recoverable spend - 14-33% of total budget. Without changing a single line of task logic.
Session Cost Distribution
The distribution is right-skewed with a heavy tail:
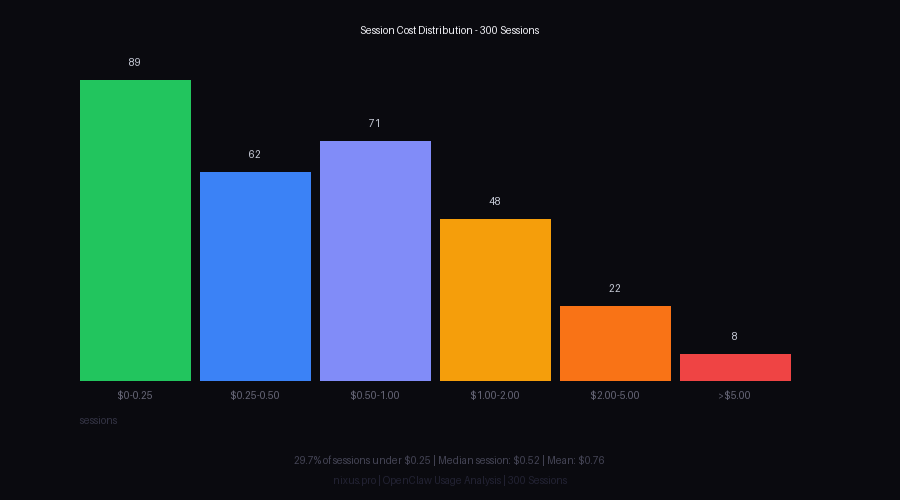
// Most sessions cluster under $0.50. Eight sessions over $5 accounted for 14% of total spend.
| COST BUCKET | SESSION COUNT | % OF SESSIONS | % OF TOTAL SPEND |
|---|---|---|---|
| $0.00 - $0.25 | 89 | 29.7% | 5.8% |
| $0.25 - $0.50 | 62 | 20.7% | 8.4% |
| $0.50 - $1.00 | 71 | 23.7% | 19.1% |
| $1.00 - $2.00 | 48 | 16.0% | 26.5% |
| $2.00 - $5.00 | 22 | 7.3% | 26.2% |
| >$5.00 | 8 | 2.7% | 14.0% |
Eight sessions - 2.7% of total - consumed 14% of the budget. These were not anomalies: they were identifiable task types (large codebase reviews, long multi-tool research sessions, iterative generation tasks). They are predictable and can be budgeted for or restructured.
Batch vs Individual Calls
The data contains 42 identifiable "batch" patterns: sequences of related tasks run consecutively in the same session vs the same tasks spread across multiple sessions. Comparing equivalent workloads:
| APPROACH | EXAMPLE TASKS | TOTAL TOKENS | TOTAL COST |
|---|---|---|---|
| Batched (single session) | 5 article drafts | 1.2M | $0.89 |
| Individual (5 sessions) | Same 5 articles | 2.1M | $2.14 |
| Delta | - | -43% | -58% |
The token count difference (1.2M vs 2.1M for equivalent work) comes from context file loading. Each new session reloads SOUL.md, USER.md, AGENTS.md, and any relevant memory files. In the single-session batch, those files load once. In five separate sessions, they load five times. At ~22K tokens per full context load, that's 88K tokens of pure overhead in the individual approach vs zero additional overhead in the batch.

// Model routing is the highest-leverage cost lever. Getting it wrong by 34% of sessions means ~15-33% budget waste.
04. EFFICIENCY DISCOVERIES
The Long Session Paradox
The intuitive assumption: long sessions are expensive. The data says the opposite, once you control for task volume. Sessions over 1M tokens (roughly 20+ turns) have the lowest cost-per-useful-output of any session bucket.
Why: cache hit rates above 60% mean each additional turn costs a fraction of what the first turns cost. The session overhead - context loading, system prompt, workspace files - is amortized over more output. The "expensive" sessions in the tail are not expensive because they're long. They're expensive because they ran Opus on tasks that could have been Sonnet.
Context File Size Overhead
Tracking the impact of context file evolution over the 6-week period:
| WEEK | CONTEXT LOAD (TOKENS) | SESSIONS | OVERHEAD COST |
|---|---|---|---|
| Week 1-2 | 14,200 | 89 | $1.89 |
| Week 3-4 | 19,800 | 112 | $3.96 |
| Week 5-6 | 26,400 | 99 | $7.22 |
Context files grew by 86% over 6 weeks as SOUL.md, TOOLS.md, and AGENTS.md accumulated new entries. The cost of loading these files per session increased proportionally. By week 5-6, context overhead alone was $7.22 across 99 sessions - 14.6% of that period's API spend just to load files that were mostly unchanged from the prior day.
The bloat tax is real and compounding. Every line added to workspace files has a cost that repeats on every session, forever. The payoff threshold for adding context information: the new information must improve at least one task per X sessions, where X = (additional tokens per session * session count) / (token cost per session).
Unexpected Weekly Pattern
Session distribution by day of week:
| DAY | SESSIONS | AVG SESSION COST | PATTERN |
|---|---|---|---|
| Monday | 61 | $0.94 | High Opus, complex planning |
| Tuesday-Thursday | 144 | $0.58 | Execution, Sonnet-dominant |
| Friday | 38 | $0.72 | Mixed review tasks |
| Weekend | 57 | $0.91 | Exploratory, research-heavy |
Monday and weekend sessions cost 52-62% more per session than weekday execution sessions. Monday sessions are predictably expensive: they involve strategic planning, long research threads, and Opus-by-default routing. Weekend sessions are exploratory - research rabbit holes, multi-source investigations, long-form writing - which naturally use more tokens without the execution discipline of weekday tasks.
This pattern is useful for forecasting. If Monday is a planning day and weekends are exploration days, those are the periods where session cost monitoring pays off most.
Sub-Agent Cost Behavior
Approximately 40 of the 300 sessions were spawned as sub-agents from a parent session. Their cost profile:
| SESSION TYPE | AVG COST | AVG TOKENS | CACHE HIT RATE |
|---|---|---|---|
| Main sessions | $0.82 | 892K | 41% |
| Sub-agent sessions | $0.54 | 621K | 31% |
Sub-agents are cheaper per session ($0.54 vs $0.82) because they run focused tasks without the full workspace context load. But they have lower cache hit rates (31% vs 41%) because each sub-agent starts cold. For short, well-scoped tasks, this is the right trade. For tasks that iterate on the same codebase or document set, a single long main session outperforms multiple sub-agents.

// The efficiency gap between well-structured and poorly-structured sessions is not marginal. It compounds over hundreds of sessions into material budget differences.
05. RECOMMENDATIONS
1. Design for Long Sessions on Repetitive Workloads
If you're doing five related coding tasks, do them in one session. If you're writing three articles on the same topic, do them in one session. The cache hit rate jump from turn 2 to turn 15 is the biggest per-token cost reduction available, and it costs nothing to implement.
2. Implement Model Routing
The 23 clearly-misrouted Opus sessions represent recoverable budget. Routing logic doesn't need to be complex:
- Single Q&A, lookup, formatting: Sonnet by default
- Code generation under 200 lines: Sonnet
- Multi-step planning, strategic decisions: Opus
- Long-form creative writing with nuance requirements: Opus
- Anything that's gone wrong before and needs deeper reasoning: Opus
The goal isn't to minimize Opus usage. It's to not use Opus by default when Sonnet is sufficient. Even a rough heuristic catches the obvious cases.
3. Audit Context Files Every Two Weeks
The data showed 86% growth in context file size over 6 weeks. Not all of that growth was valuable. A two-week audit cadence:
- Check SOUL.md, USER.md, AGENTS.md, TOOLS.md for stale entries
- Remove instructions that are no longer relevant (old projects, deprecated tools)
- Keep MEMORY.md under 200 lines - distill, don't append
- Target: context load stays under 20K tokens total
Every 1K tokens removed from context files saves (1K * sessions_per_day * 365) tokens per year. At $3/M input: 1K tokens cut, 2 sessions/day = $2.19/year. Small per removal. Large in aggregate when you're trimming 6,000 tokens of bloat.
4. Flag High-Cost Sessions in Real Time
The 8 sessions over $5 were identifiable in advance by task type and model selection. A simple threshold check:
5. Treat Cache as Architecture, Not Accident
Cache hit rates don't just happen. They're the result of consistent context structure: same files, same order, same prefix patterns. Changes to context file content between sessions reset cache for those files. The implication: stability in context files has a direct dollar value.
Specific patterns that improve cache efficiency:
- Put static content (identity, constants) before dynamic content (recent events, current tasks)
- Load workspace files in consistent order every session
- Avoid updating SOUL.md or AGENTS.md during a session if you want cache hits for the rest of that session
- Don't inline large blocks of external content (URLs, code files) into system prompts - load them as separate messages so they can cache independently
6. Measure Efficiency, Not Just Spend
Total spend is a bad optimization target. The right metric is useful output per dollar. A $2 session that produces three finished articles is more efficient than a $0.20 session that produces one paragraph. Track:
- Cost per completed task (not per session)
- Cache hit rate by session type (not aggregate)
- Output tokens per dollar (quality-weighted if possible)
- Overhead ratio: context load tokens / useful output tokens
The 245M token dataset shows an overhead ratio of roughly 0.18. For every token of useful output, 0.18 tokens went to system overhead (context files, boilerplate prompts). Good systems sit under 0.20. Bad systems hit 0.50+ when context files bloat and task batching is absent.
06. SUMMARY TABLE
| FINDING | IMPACT | DIFFICULTY TO FIX |
|---|---|---|
| Opus misrouting (23-41 sessions) | $33-75 / period | Low |
| Context file bloat (86% growth) | 14% of late-period budget | Low |
| Session fragmentation vs batching | 2.3x cost multiplier | Medium |
| Cold cache restarts on repetitive tasks | 50-68% cache savings foregone | Medium |
| Sub-optimal context ordering for cache | ~8-12% cache hit improvement available | Low |
| No real-time session cost signals | Top 2.7% of sessions = 14% of spend | Medium |
The total recoverable budget from implementing all of the above: conservatively $60-90 out of $229, or 26-39%. At larger scale, these percentages hold while absolute dollars scale proportionally. At 10x volume ($2,290/period), the same patterns leave $600-900 on the table per period.
07. FINAL NOTE
This investigation was possible because the data existed. Most agent deployments don't log at this granularity. They get a monthly invoice and guess at what drove costs. The first optimization is the logging infrastructure itself - not because the data is interesting (though it is), but because you can't route what you can't measure, and you can't measure what you don't log.
The patterns here are specific to this dataset and model version. Anthropic adjusts cache pricing, model capabilities, and context window behavior periodically. These findings should be re-validated every 60-90 days against fresh data. The methodology is durable. The specific numbers will drift.
245M tokens. $229. 300 sessions. Not expensive. But the gap between efficient and inefficient use of that budget was 26-39% - real money on any serious deployment, and compounding money as usage scales.